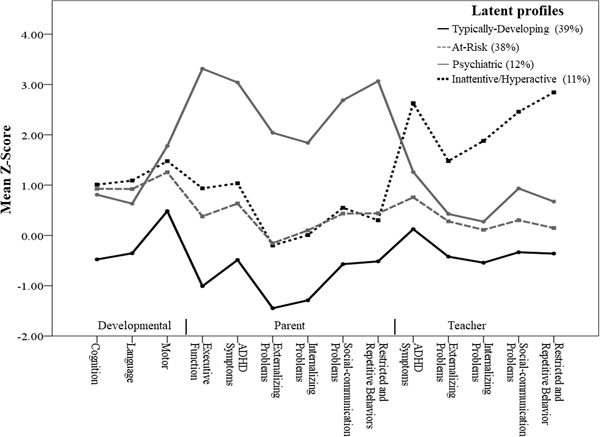
Figure 1.

Figure 1 shows four profiles spanning a Typically-Developing Group (39%), an At-Risk Group (38%), a Psychiatric Group (12%) and a school-based Inattentive/Hyperactive Group (11%). Note: standardized scores for developmental measures are reverse coded to correspond with parent- and teacher-reports of psychopathology.
