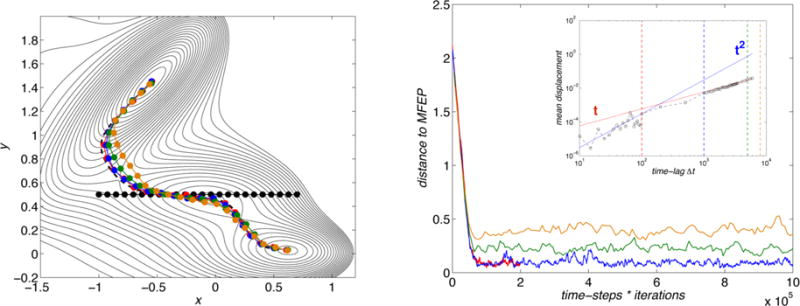
Figure 2.

Convergence of the swarms-of-trajectories method. The left panel shows the Mueller surface with the initial string (black circles) and the MFEP (black dashed line), together with the final paths (circles) obtained using 103 trajectories in the swarms and different time lags Δt (red = 100 steps, blue = 1000, green = 5000, orange = 8000). Right panel: distances from the MFEP as a function of the total number of steps during the evolution of the strings, using the same color coding as in the left panel. The inset shows how the mean displacement of the trajectories in a swarm varies when increasing the time lag Δt: the red and blue solid lines indicate linear and quadratic behaviors, respectively, while the vertical dashed lines show the time lag Δt used with the same color code of the main panels. In this calculation, the trajectories were started from the point (x, y) = (−1.2, 1.4) on the Mueller surface.
