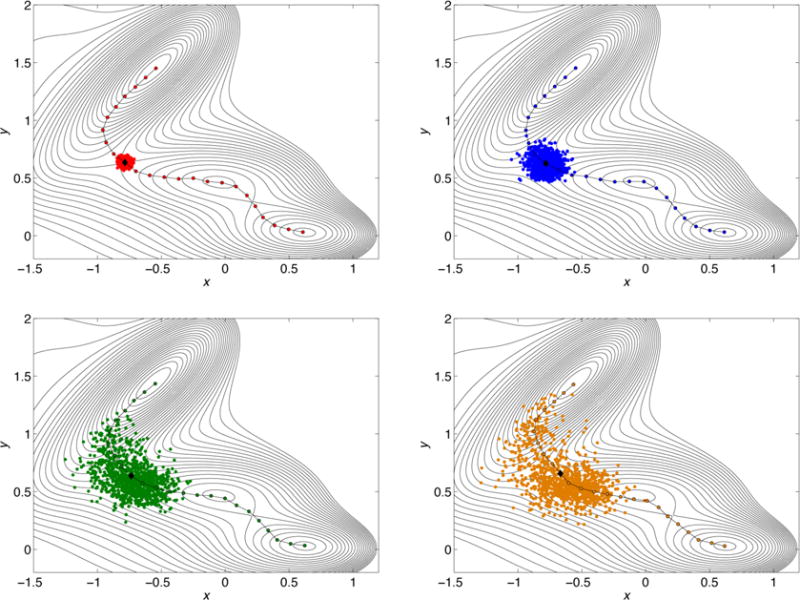
Figure 3.

Spread of the free trajectories in the swarm around a selected image on the converged path at different trajectories length. Going from left to right and top to bottom it is shown the spread at different time lags Δt: the number of MD steps in the free swarm trajectories are 100, 1000, 5000, and 8000, respectively, and the color code is the same of Figure 2. The image chosen is indicated with a black diamond and it is an approximation of the saddle point in the different strings.
