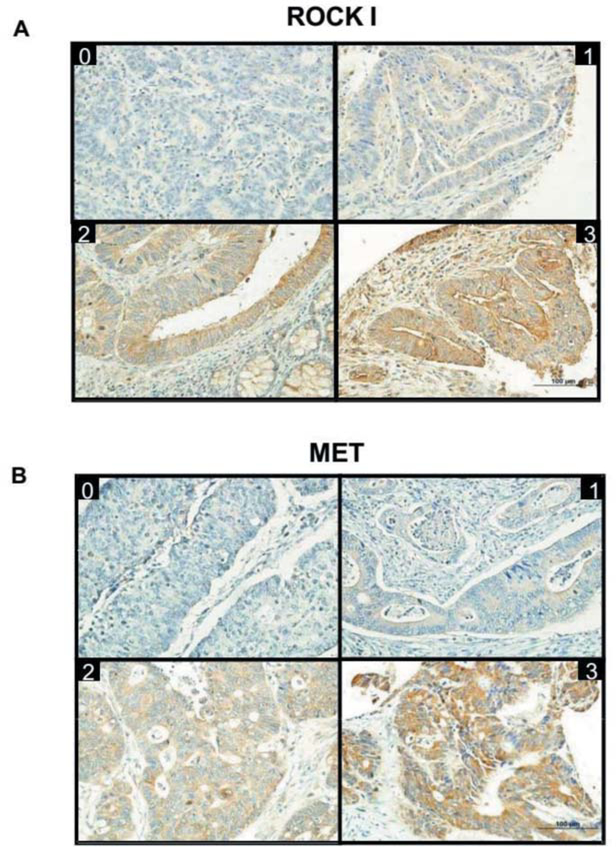
Figure 2.
Specific immunostaining for ROCK I and MET proteins in colorectal cancer. Tissue microarray slides were prepared with primary antibodies specific for ROCK I and MET. Representative images of the immunohistochemistry results for ROCK I (Panel A) and MET (Panel B) are shown. Intensity of staining is labeled as 0 (no staining detected), 1, 2 or 3 (high intensity) on the upper part of each picture.

