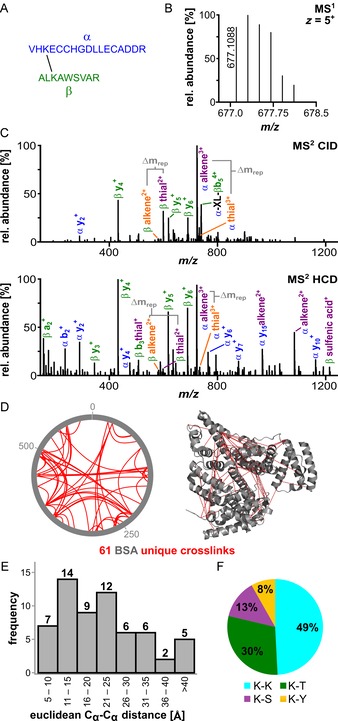
Figure 2.

Analysis of crosslinked BSA prior to enrichment. A) Sequences of a representative crosslink within BSA: peptide α: VHKECCHGDLLECADDR (IAA‐modified on Cys) and β: ALKAWSVAR. B) The isotope envelope of the 5+ precursor is shown. C) Fragmentation of the crosslinked peptides under CID (25 %, top spectrum) and stepped higher energy collisional dissociation (HCD) conditions (25/30/32 %, bottom spectrum) showing the product ions of sulfoxide cleavage. The different fragmentation pathways are shown in orange and purple (Figure 1). D) MS2 identification of BSA crosslinking sites prior to enrichment. The xVis representation shows the positions of crosslinked amino acids as red lines (left). The corresponding Cα−Cα distances are depicted in the BSA crystal structure (PDB ID: 4F5S22). E) Histogram of the measured Euclidean Cα−Cα distances in the crystal structure; the majority are below 40 Å, with a mean measured distance of 22.1 Å. F) Distribution of the identified crosslinking sites between Lys–Lys, Lys–Thr, Lys–Ser and Lys–Tyr.
