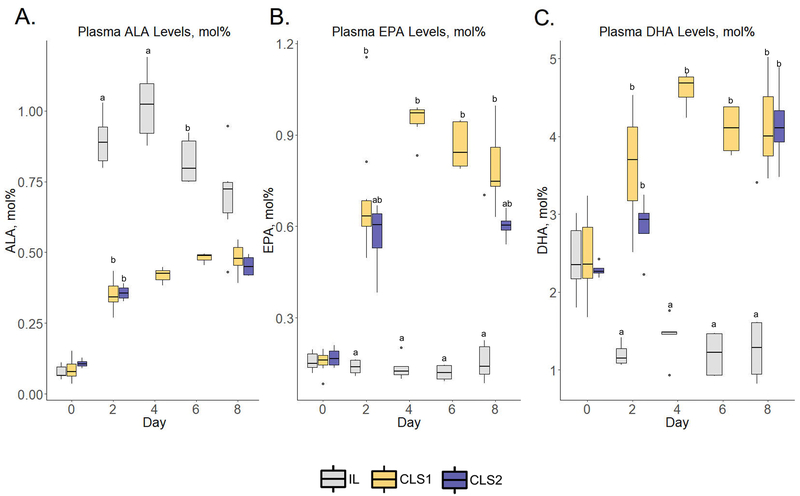
Figure 1.
Plasma n-3 fatty acid profiles determined by gas chromatography–mass spectrometry in the IL (gray), CLS1 (yellow), and CLS2 (blue) groups. The concentration of alpha-linolenic acid (ALA, panel A), eicosapentaenoic acid (EPA, panel B) and docosahexaenoic acid (DHA, panel C) are presented as mol% in the form of box plots. Labeled points without a common letter represent a statistically significant difference of P˂0.05. ALA, alpha-linolenic acid; CLS, concentrated lipid supplement; DHA, docosahexaenoic acid; EPA, eicosapentaenoic acid; IL, Intralipid®-control.

