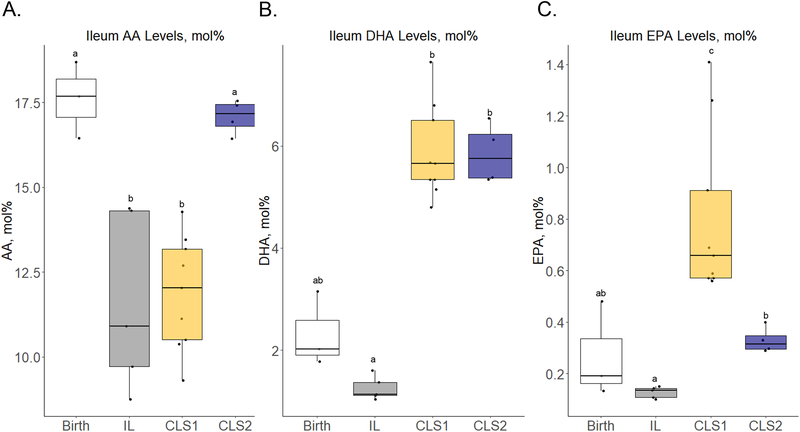
Figure 3.
Select fatty acid profiles in the distal ileum (A-C) determined by gas chromatography–mass spectrometry presented as mol% in the form of box plots at birth (white) and in the IL (gray), CLS1 (yellow), and CLS2 (blue) groups. Labeled points without a common letter represent a statistically significant difference of P˂0.05. AA, arachidonic acid; CLS, concentrated lipid supplement; DHA, docosahexaenoic acid; EPA, eicosapentaenoic acid; IL, Intralipid®-control.

