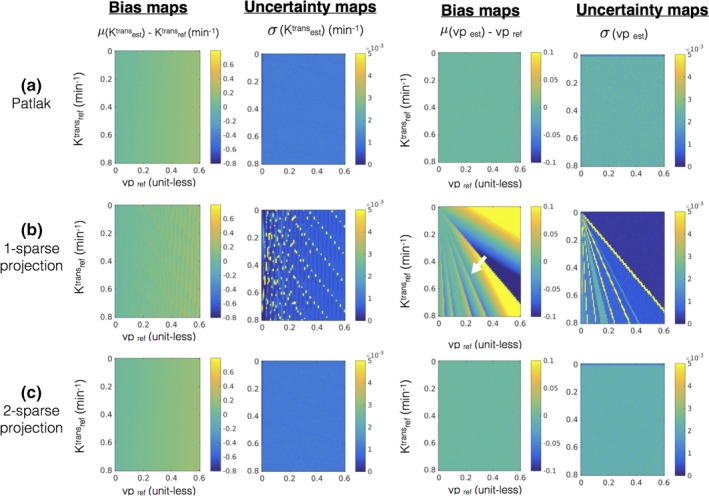
Figure 4.

Error statistics (bias and uncertainty) in estimating kinetic parameters in the presence of noise with the Patlak model. The first row in (a) shows the bias and uncertainty in estimating kinetic parameters from the noisy concentration vs time profiles and is considered as reference. Rows (b) and (c) show the bias and uncertainty in kinetic parameter estimation after q‐sparse projection of the noisy profiles with different values of q, and is evaluated against the reference. It can be seen from (b) that q = 1 demonstrates considerable bias (e.g., see the white arrow in bias maps while estimating vp). However, when q = 2, the bias and uncertainty maps are equivalent to the reference, which motivated the choice of q = 2 for the Patlak model. [Color figure can be viewed at http://www.wileyonlinelibrary.com]
