Fig. 3.
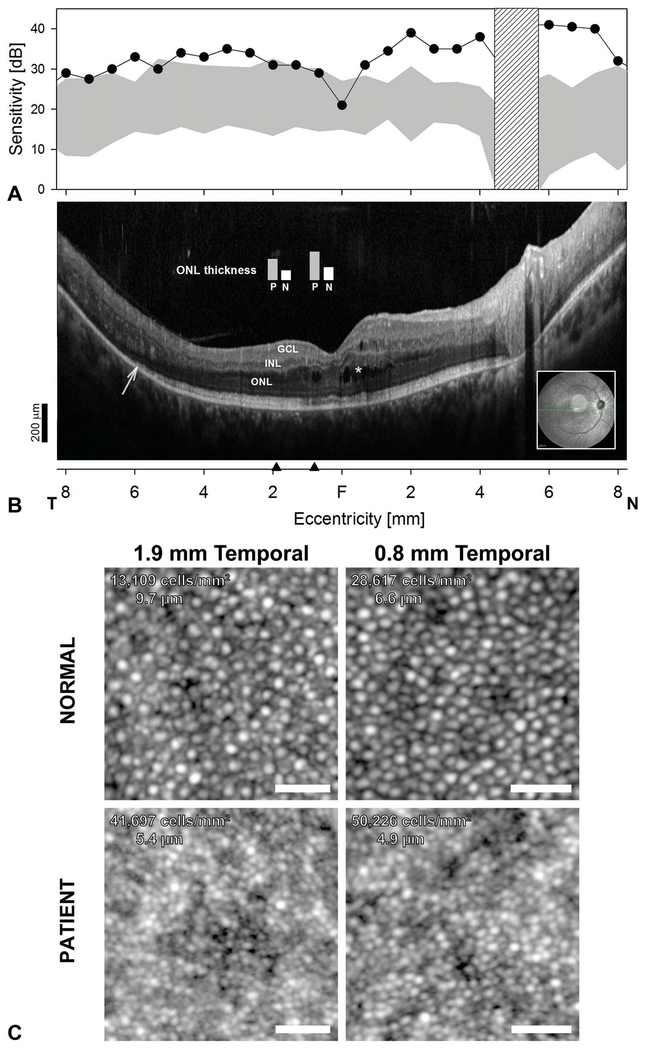
A. Central retinal function and colocalized cross-sectional and cellular structure in ESCS. S-cone sensitivity profiles measured with a 440-nm stimulus on a yellow L-M cone adapting background compared with the normal range (gray band = mean ± 2 SD). Hatched bar: blind spot. B. Horizontal, 16.5-mm, SD-OCT through the fovea in the patient. Inset is an NIR-REF image with the location and orientation of the scan (green arrow). Asterisks denote cystoid spaces. Arrow points to transition zone where the ISe band becomes undetectable. Black arrow heads on the eccentricity axis denote locations where ONL thickness measurements from the patient (P) were compared with normal measurements (N) (plotted as vertical bars overlaid above SD-OCT cross-section). Scale bar is to the bottom left; (A and B) share the same eccentricity scale. C. AOSLO images from the patient with ESCS compared with a normal. Cone densities and cone spacing are denoted in panel. Cone density is approximately 2- and 3-fold higher than normal in the patient at 0.8 mm and 1.9 mm (~3° and 6°) temporal to the fovea, respectively. Scale bar: 25 μm.

