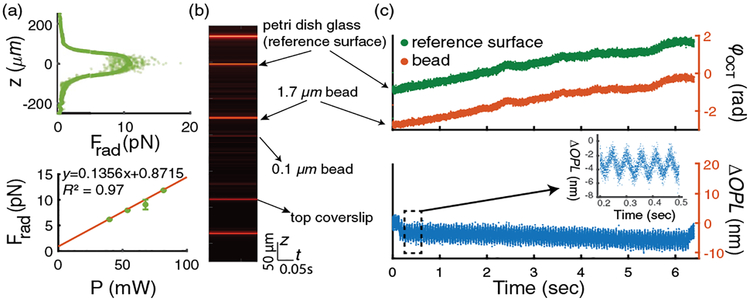
Fig. 2.
(a) Calibration of depth-dependent PF. Top: depth-resolved PF profile with optical power of ~78 mW in sample, data smoothed by moving averaging method are plotted as points with lower transparency; bottom: Frad(z= 0) under different excitation pump powers with a linear curve fit. (b) Measured M-mode OCT images of 1.7 μm beads in response to 18 Hz PF excitation. (c) Top: time-dependent OCT phase ϕOCT; bottom: ΔOPL of beads.

