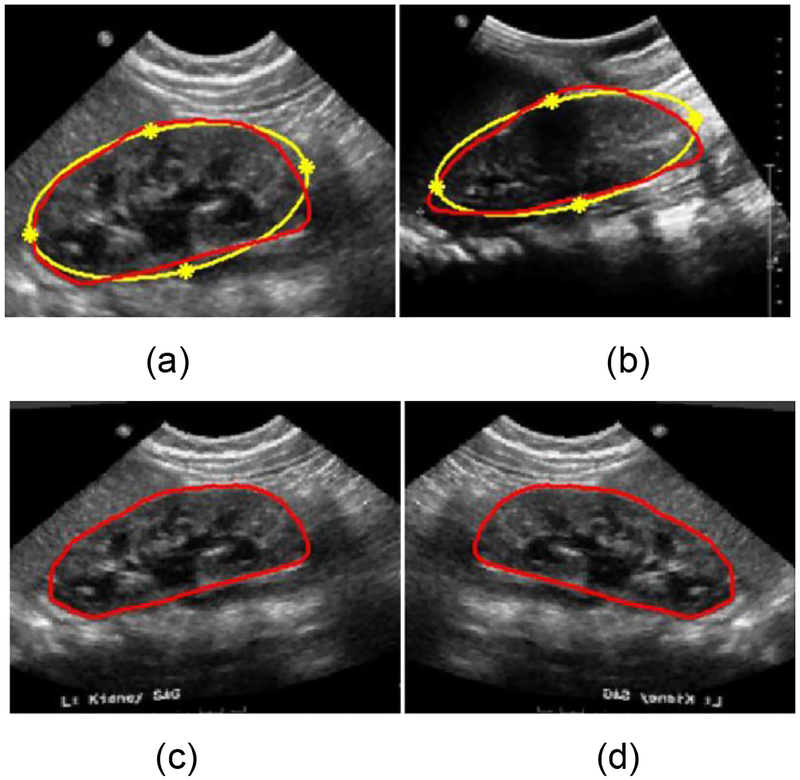
Fig. 8.
Data-augmentation based on TPS transformation and flipping. (a) is a moving image, (b) is a fixed image, (c) is the registered image and (d) is the flipped registered image. The kidney shape denoted by the red curve is approximately modeled as an ellipse denoted by the yellow curves. The yellow stars denote the landmark points of the TPS transformation.

