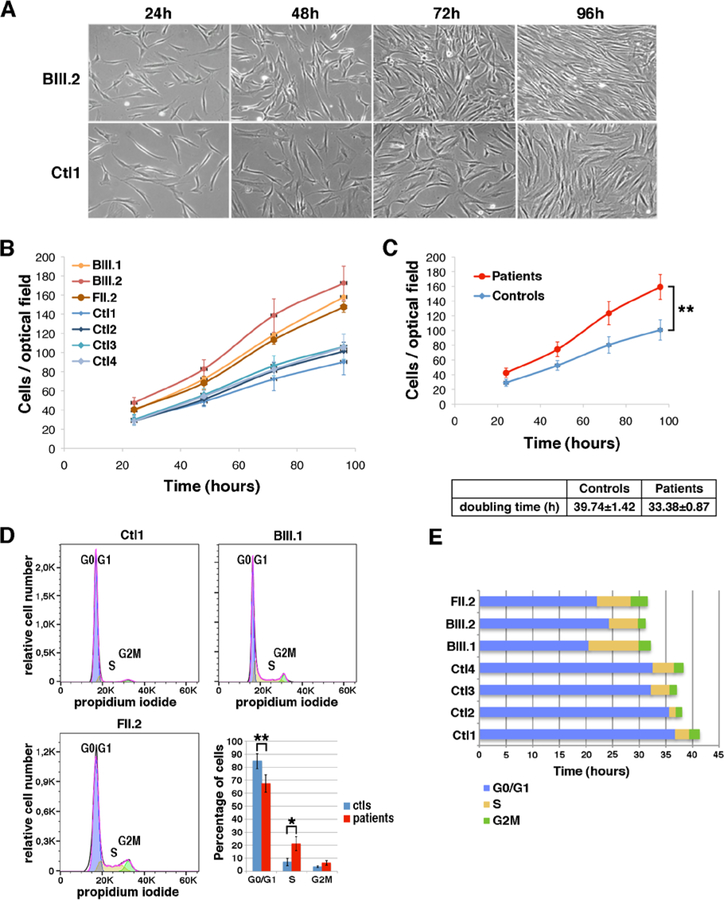
Fig. 4: Accelerated proliferation and reduced G0/G1 phase of the cell cycle in patient fibroblasts.
(A) Bright-field pictures of control (Ctl1) and patient (BIII.2) fibroblasts cultures from 24 to 96 hours after seeding (B) proliferation curves from four control (blue) and three patient fibroblasts cultures (red). (C) Differences between the proliferation curves from control and patient cells were significant (ANOVA 3DF, *p-value<0.001). Mean population doubling time of control and patient cells was calculated for cells in exponential proliferation between 48 and 72h. (D) FACS analysis of cell cycle progression in non-synchronous proliferative control (Ctl1) or patient (BIII.1; FII.2) fibroblasts. Histogram showing the mean percentage of cells per phase in the four controls and three patients fibroblast samples (ANOVA 2DF, p-value <0.001; Tukey HSD *p-value 0.01 **p-value 0.002). (E) The duration of cell cycle phases G0/G1 (blue), S (yellow) and G2M (green) for each sample was determined as the percentage of cells in each phase multiplied by the doubling time corresponding to each sample.

