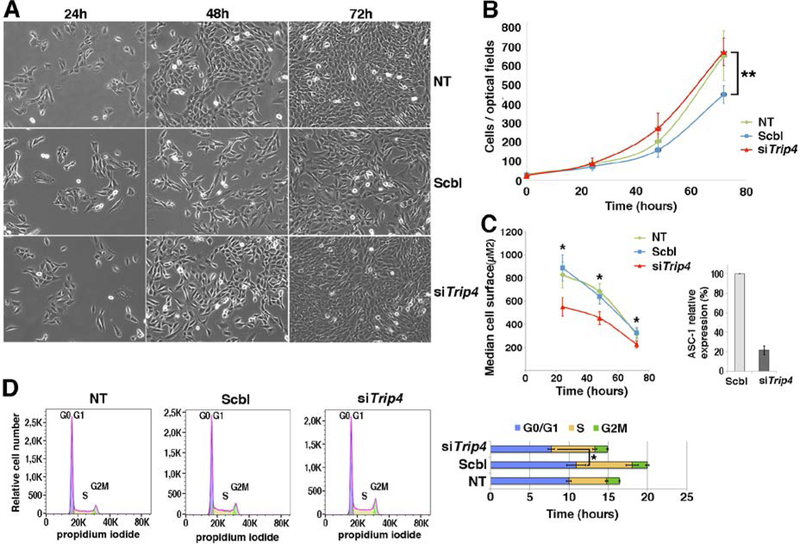
Fig. 5: Accelerated proliferation and G0/G1 phase reduction and reduced growth in Trip4KD myogenic cells.
(A) Bright-field pictures of Trip4KD C2C12 (siTrip4) compared to not treated (NT) or scramble (Scbl) transfected controls from 24 to 72 hours post siRNA transfection. (B) Proliferation curves of siTrip4, Scbl and NT cells. Overall, the proliferation curve of siTrip4 cells was higher than that from Scbl-transfected controls (ANOVA, **p-value <0.001), maintaining values comparable to non-transfected cells. Values are the mean of four independent measurements for each time per condition. Mean population doubling time (hours) was calculated for cells in exponential proliferation between 24 and 48h after transfection: NT 16.6±1, Scbl 20.1±4.4, siTrip4 15.1±1.5. (C) SiTrip4 cells exhibited a smaller cell surface (μm2) compared to NT or Scbl cells after 24, 48 or 72h of culture (Kruskal-Wallis, *p-value< 0.05). A strong ASC-1 reduction (>80%) of ASC-1 in Trip4KD cells was observed 48h after transfection. This was also observed within 48 hours with three independent siRNAs against Trip4 (data not shown). (D) FACS analysis of cell cycle in non-synchronous NT, Scbl and siTrip4 cells. Mean cell cycle distributions measured in three experiments showed a decrease in the percentage of cells in G0/G1 phase in siTrip4 condition compared to Scbl and NT (respectively 51±3.3; 54.3±6.1; 60.1±4.7), an increase in S phase (respectively 36.4±2.3; 35.6±3.9; 29.1±3.7) and in G2M (respectively 10.8±1.3; 9.64±1.1; 9.74±2.3). The duration of the cell cycle phases (±SEM), G0/G1 (blue), S (yellow) and G2M (green), was determined as mentioned in Fig. 4 (ANOVA *p-value <0.05). A parallel increase in the number of cells in S phase in both Scbl and siTrip4 samples could be explained by the stress induced by transfection.

