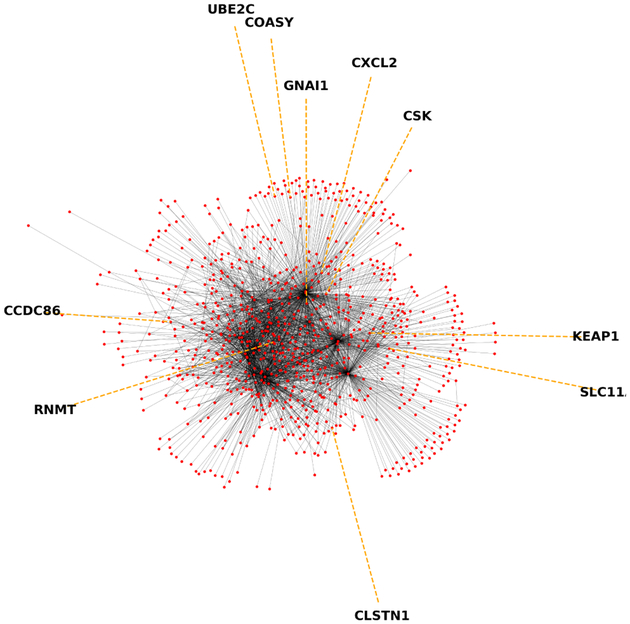
Fig. 3.
The regulatory relationships between L1000 landmark genes, as determined according to [37]. Nodes (red dots) are genes and edges between them represent known or suspected regulatory interactions. Note that many genes only have one known edge connecting them to much denser clusters within the center of the graph. This may reflect biological processes, or that some proteins are studied much more than others.

