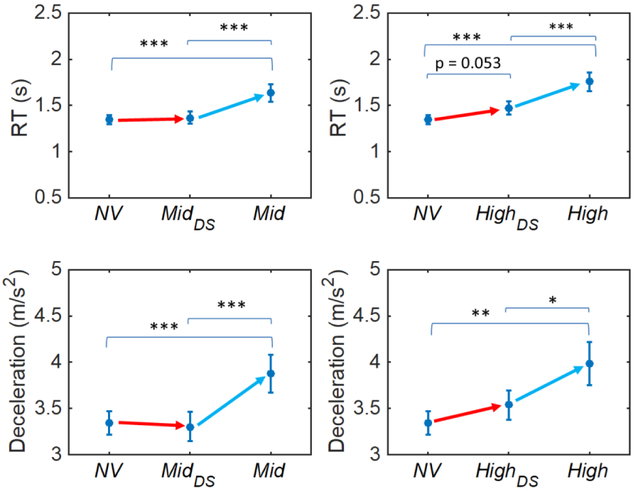
Figure 5:
Average reaction time (RT: top row) and deceleration (bottom row) across the different conditions in Experiment 2. The red arrow corresponds to the comparison whereby there is only a reduction in VA. The blue arrow corresponds to the comparison whereby there is only a reduction in CS. Error bars correspond to SEM. * = p < .05, ** = p < .01, *** = p < 0.001

