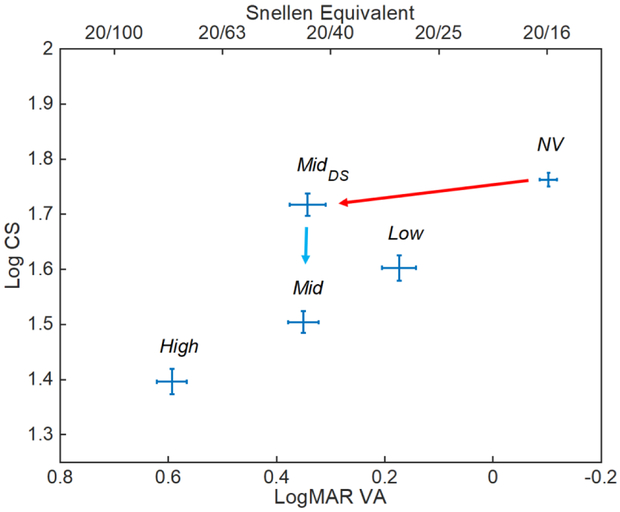
Figure A1.1.
Average contrast sensitive (CS) and visual acuity (VA) for the different conditions (NV, Low, Mid, High, MidDS) in Experiment 1. The red arrow corresponds to the comparison whereby there is only a reduction in VA. The blue arrow corresponds to the comparison whereby there is only a reduction in CS. Error bars are SEM.

