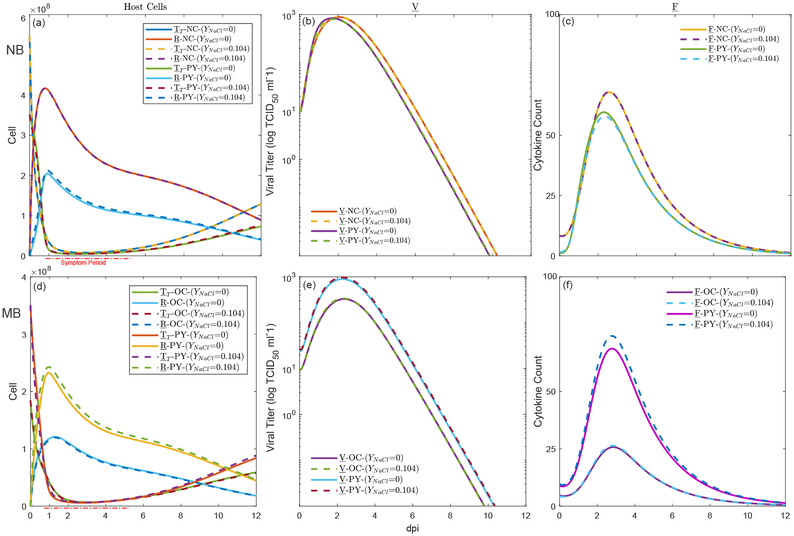
Figure 11:
Regional virus titer predictions using the CFPD-HCD model: (a-c) The HCD in the nasal cavity (NC) and the pharynx (PY) for droplets inhalation using nose (NB) with different NaCl concentrations (YNaCl=0 and YNaCl=0.104);and (d-f) The HCD in the oral cavity (OC) and the pharynx (PY) for droplets inhalation using mouth (MB) with different NaCl concentrations (YNaCl=0 and YNaCl=0.104).

