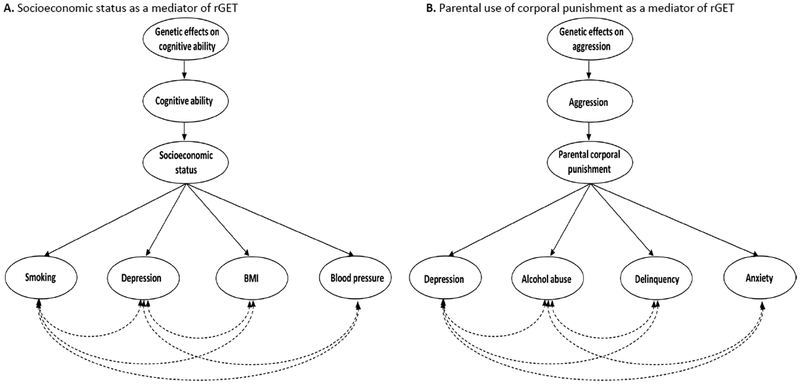
Figure 3. Gene-Environment-Trait correlation, theoretical examples.
Note. The associations between the various outcomes, the first phenotype and the genetic influences on the first phenotype are not shown, to make the figure easier to follow. Dashed double arrows depict genetic correlations, while one directional arrows depict causal pathways.

