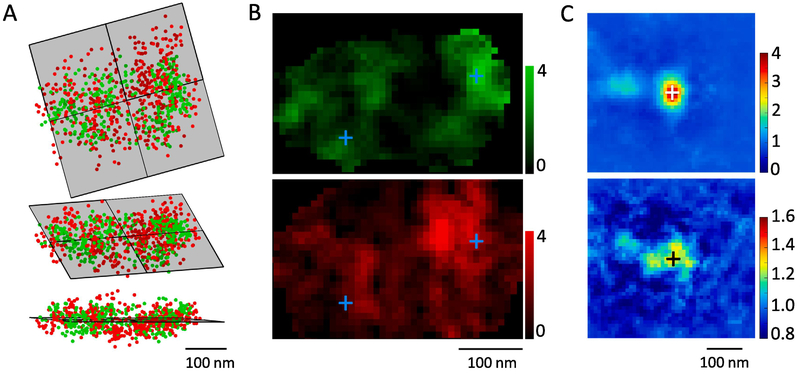
Figure 4. Automatic enface projection and averaging of synapses.
A. Calculation of the enface plane by fitting all overlapped localizations after translation. RIM1/2 is in red, PSD-95 in green. Top shows the top-view, lower the side-view and middle the elevated view. B. Local density distribution after the projection. Crosses present the peaks of two PSD-95 nanoclusters. C. Averaged PSD-95 nanocluster in projection plane and the corresponding density distribution of RIM1/2 across 103 nanoclusters from 59 synapses.PSD-95 distribution was rotated to get the best fit of the internal distribution to the original template. Note the second nanocluster ~120 nm from the center of the averaged nanocluster. RIM1/2 was rotated with the same angle as PSD-95 from the same synapse. Note the significant higher density around the averaging center.

