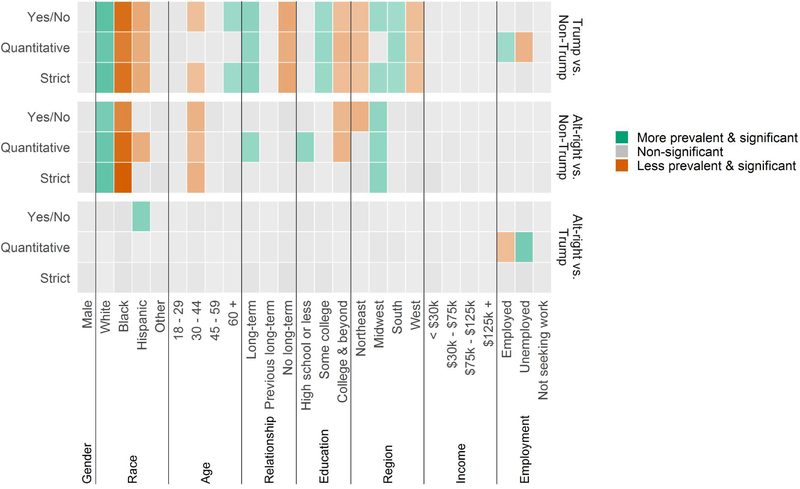
Figure 4.
Robustness of the differences in demographic prevalence across three definitions of “alt-right”. Each rectangle represents whether the demographic in question was significantly more prevalent in the first listed sample (green), significantly less prevalent (maroon), or not significantly different across samples. All statistical tests come from survey-weighted Generalized Linear Models with binomially distributed error and logit links with stratification across voting status.

