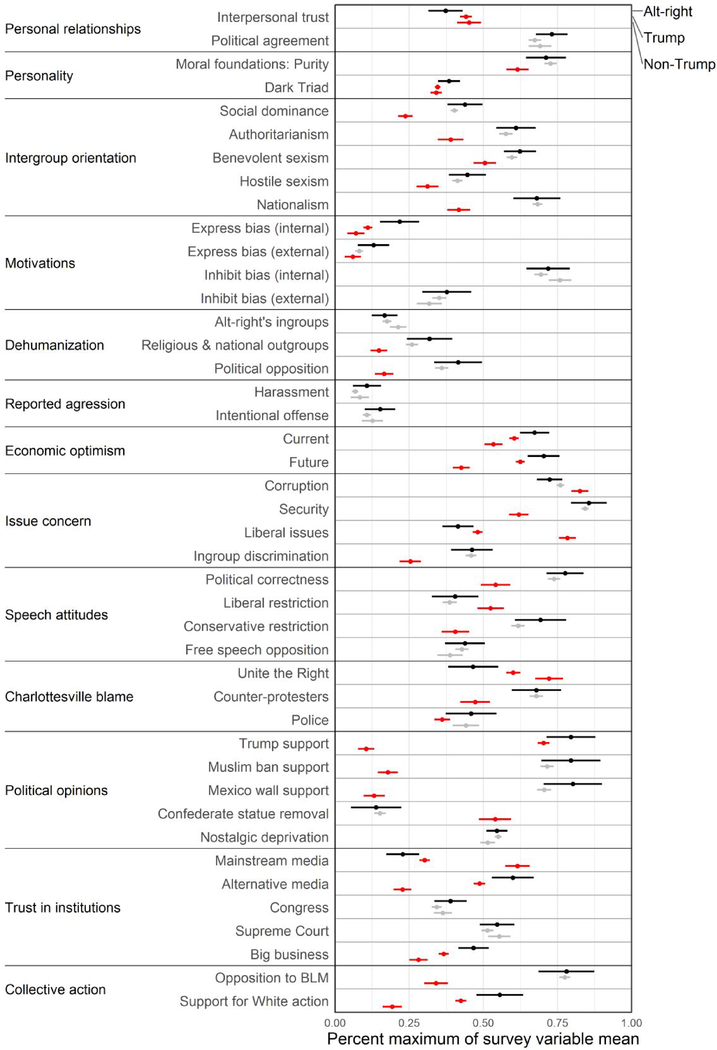
Figure 5.
Survey-weighted estimates and 95% CIs of survey responses from the alt-right and the two non-alt-right samples. Estimates come from the nationally representative sample and use the yes/no alt-right definition. All estimates are scaled in terms of the percent of the maximum possible scale response. Black dots are estimates from the alt-right respondents; red dots indicate that the estimate in question is significantly different from the alt-right estimate; grey indicates no significant difference.

