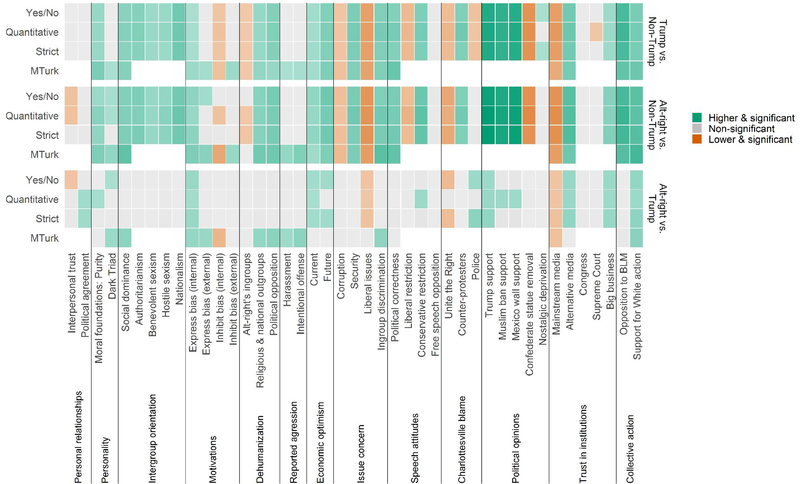
Figure 6.
Robustness of the differences across alt-right, Trump voters, and non-Trump voters across the MTurk and nationally representative samples, with three possible definitions of “alt-right supporter” in the nationally representative sample. A grey rectangle indicates the comparison in question was non-significant, maroon indicates the second group was lower and significantly different, green indicates the second group was higher and significantly different. The degree of transparency in the rectangles is proportionate to the size of the difference; the more visible the larger.

