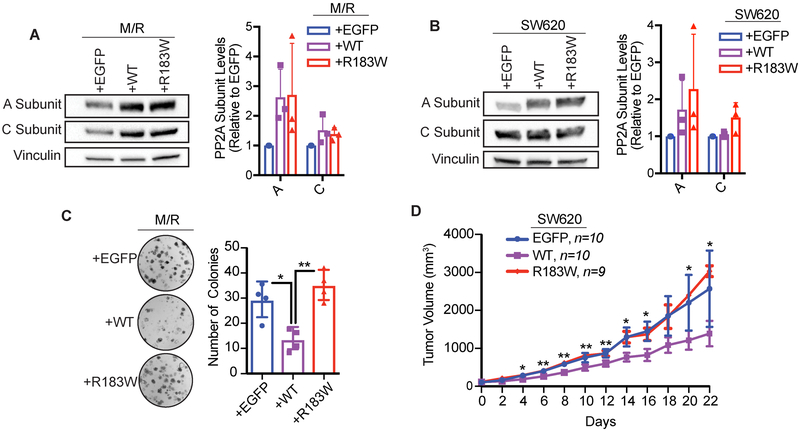
Figure 3. The R183W mutation loses growth suppressive activity compared to wild type PP2A.
(A) Western blot validation of A and C subunit expression levels from M/R stable cell lines and quantification, data presented as mean ± SD (n=3). B) Western blot validation of A and C subunit expression levels from SW620 stable cell lines and quantification, data presented as mean ± SD (n=3). (C) Clonogenic assay of M/R cells, briefly, 500 cells were seeded in 6 well plates and allowed to grow for 10 days, then fixed, stained with crystal violet, and quantified via ImageJ. Three technical replicates per biological replicate, data represented as the mean ± SD (n=4). (One-way ANOVA; Tukey’s correction for multiple comparisons, p-values: *<0.05, **≤0.01). (D) Xenograft assay of SW620 cells expressing EGFP (control vector) (n=10), wild type Aα (n=10) or Aα-R183W (n=9), injected subcutaneously into the flanks of female nude mice. Tumors were measured every other day. Data are presented as mean ± SEM (Students T-tests, R183W relative to WT, p-values: * < 0.05, ** ≤ 0.01).

