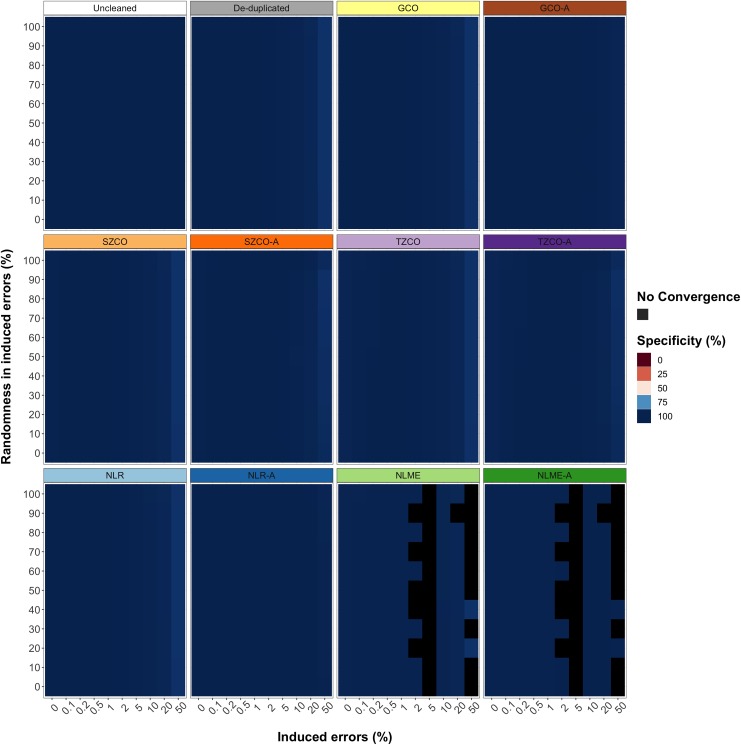
Fig 4.
The specificity of uncleaned, de-duplicated and data cleaned with five data cleaning approaches with and without our algorithm (A) for longitudinal weight measurements in CLOSER data with different rates and types of simulated errors. Errors were simulated for 0%, 0.1%, 0.2%, 0.5%, 1%, 2%, 5%, 10%, 20% and 50% of the data. Random errors were simulated between the values of 0.0001 and 500, for 0%, 10%, 20%, 30%, 40%, 50%, 60%, 70%, 80%, 90% and 100% of the overall errors, where fixed errors made up the remaining percentage of errors. Fixed errors comprised of manipulating measurements by multiplying and dividing by 10, 100 and 1000, adding 100 and 1000, converting to the metric and imperial units and transposing the number. Specificity was calculated as the mean percentage of non-simulated (true-negative) measurements that were correctly identified.

