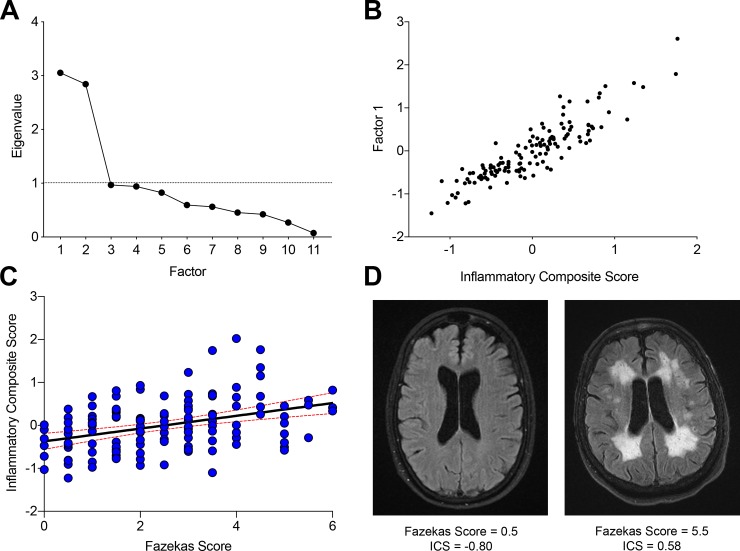
Fig 6. ICS is associated with white matter injury in those at risk for stroke.
Scree plot of principal components analysis of data from ASPIRE cohort serum biomarker panel with two main factors (Factor 1 and Factor 2) driving variance (A). Scatter plot of Factor 1 values versus ICS in this cohort demonstrating a significant correlation (r = 0.94) (B). Scatter plot and regression line of modified Fazekas score and ICS for individual subjects (C). Red dashed lines indicate 95% confidence intervals. Representative T2/FLAIR MR images of ASPIRE subjects with low (left) or high (right) ICS scores (D).

