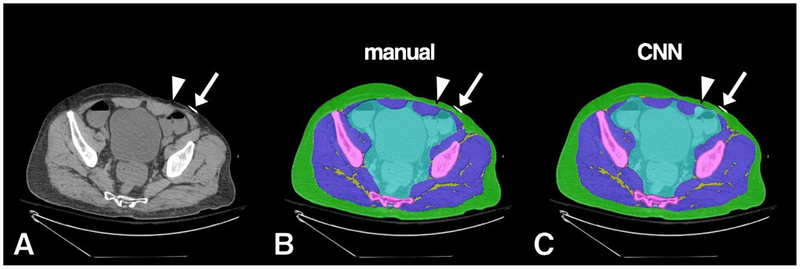
Figure 8.
Example of misclassification of soft tissue density in the left anterior abdominal wall. Original grayscale image (A), manual segmentation (B) and CNN automated segmentation (C). A small area of CNN misclassification is seen along the left rectus abdominis muscle (arrowhead). A metallic density on the anterior skin was correctly ignored by the model as background (arrow).

