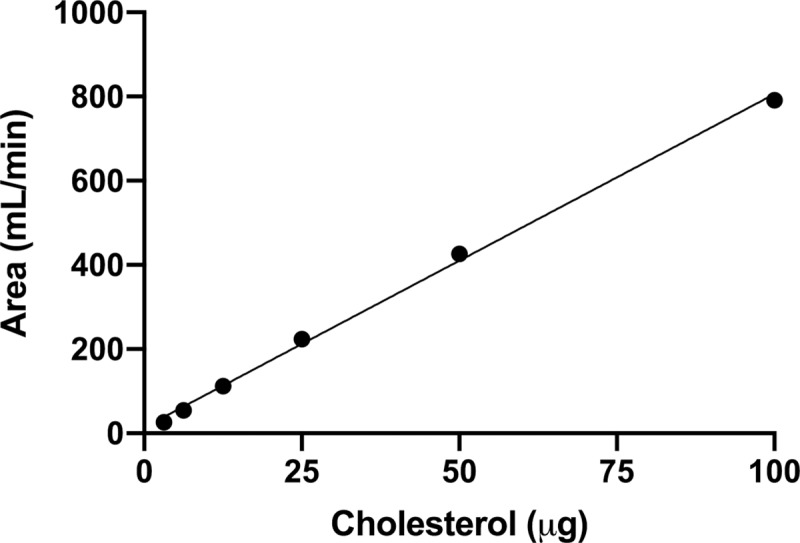
Fig 3. Calibration curve used to determine the amount of cholesterol in the experimental samples.

The linear regression showed very good correlation (y = 7.89 x + 13.47; R2 = 0.9981).

The linear regression showed very good correlation (y = 7.89 x + 13.47; R2 = 0.9981).