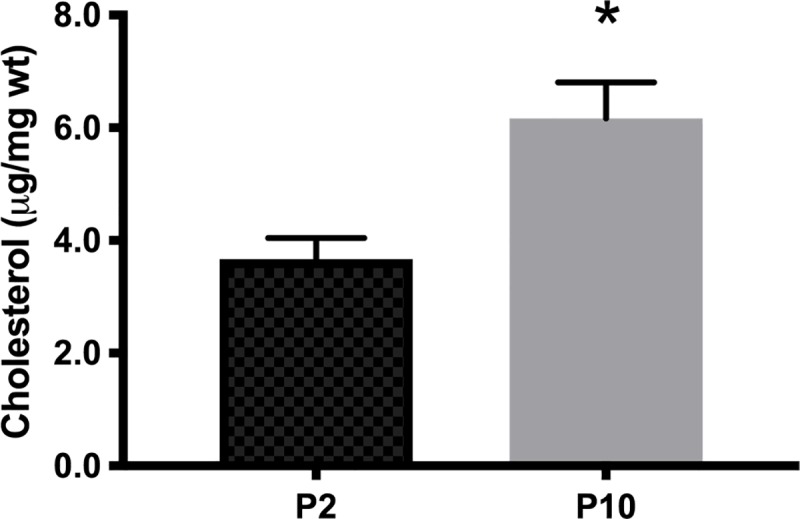
Fig 4. Cholesterol concentrations in whole brains of C57BL6 mice at postnatal days 2 (P2) and 10 (P10).

Data are expressed as μg of cholesterol/mg of wet tissue (μg/mg wt). Bars represent mean ± SEM (n = 3); * p < 0.05, Student’s t-test.

Data are expressed as μg of cholesterol/mg of wet tissue (μg/mg wt). Bars represent mean ± SEM (n = 3); * p < 0.05, Student’s t-test.