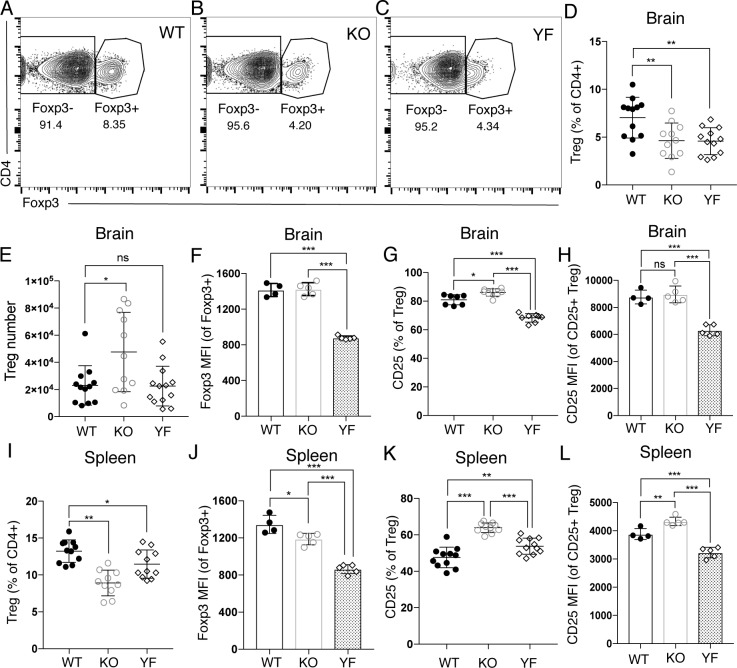
Fig 2. ICOS KO and ICOS YF mice have distinct Treg defects in the brain during chronic T. gondii infection.
Immune cells were isolated from the brains (A-H) and spleens (I-L) of chronically infected WT, ICOS KO, and ICOS YF mice and analyzed by flow cytometry. (A-C) Representative flow cytometry plots are shown indicating the decrease in Treg frequency in the brain observed in ICOS KO and ICOS YF mice during chronic infection. (D) Total Treg frequency in the brain (n = 3–5 per group, data is pooled from three independent experiments and analyzed by randomized block ANOVA). (E) Treg number in the brains of WT, ICOS KO, and ICOS YF mice (n = 3–5 per group, data is pooled from three independent experiments and analyzed by randomized block ANOVA). (F) MFI of Foxp3 in the Treg population isolated from the brain during chronic infection (n = 4–5 per group, data is representative of three independent experiments and analyzed by one-way ANOVA). (G) The frequency of CD25+ Tregs in the brain (n = 3–5 per group, data is pooled from three independent experiments and analyzed by randomized block ANOVA). (H) MFI of CD25 on CD25+ Tregs in the brain (n = 4–5 per group, data is representative of three independent experiments and analyzed by one-way ANOVA). (I) The frequency of Tregs among the CD4+ population in the spleen during chronic infection (n = 3–5 per group, data is pooled from three independent experiments and analyzed using randomized block ANOVA). (J) The MFI of Foxp3 on Tregs in the spleen during chronic infection (n = 4–5 per group, data is representative of three independent experiments and analyzed using one-way ANOVA). (K) The frequency of CD25+ Tregs in the spleen during chronic infection (n = 3–5 per group, data is pooled from three independent experiments and analyzed by randomized block ANOVA). (L) MFI of CD25 on CD25+ Tregs in the brain (n = 4–5 per group, data is representative of three independent experiments and analyzed by one-way ANOVA). * denotes p<0.05, ** denotes p<0.01, and *** denotes p<0.001 for all panels.

