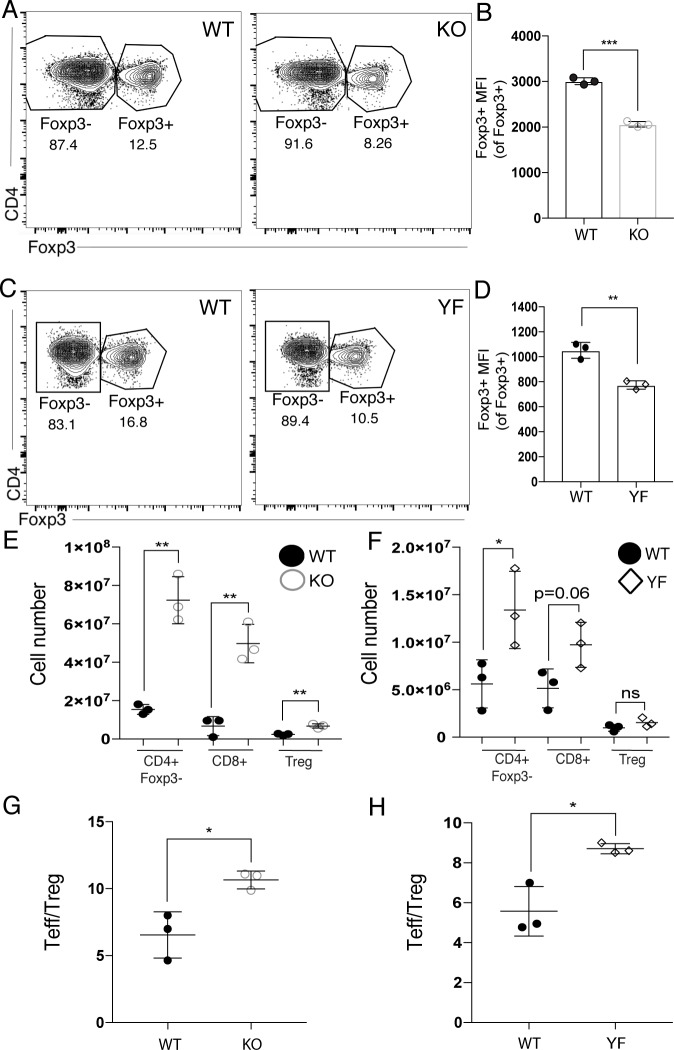
Fig 4. ICOS KO and ICOS YF mice have baseline defects in Foxp3 expression and Treg frequency, as well as expanded effector T cell populations in the spleen.
(A) Representative flow plots showing the decrease in the frequency of Tregs in the spleens of ICOS KO compared to WT controls. (B) MFI of Foxp3 in Tregs in the spleen of uninfected WT and ICOS KO mice (n = 3 per group, data is representative of two independent experiments and analyzed by Student’s t-test). (C) Representative flow plots showing the decrease in the frequency of Tregs in the spleens of ICOS YF mice compared to WT controls. (D) MFI of Foxp3 in Tregs in the spleen of uninfected WT and ICOS YF mice (n = 3 per group, data is representative of two independent experiments and analyzed by Student’s t-test). (E-F) Immune cells were isolated from the spleens of ICOS KO (E) and ICOS YF (F) and T cell numbers were compared to WT controls (n = 3 per group, data is representative of two independent experiments and analyzed by Student’s t-test). The Teff/Treg ratio in the spleen of uninfected mice was calculated in ICOS KO (G) and ICOS YF (H) mice (n = 3 per group, data is representative of two independent experiments and analyzed by Student’s t-test).

