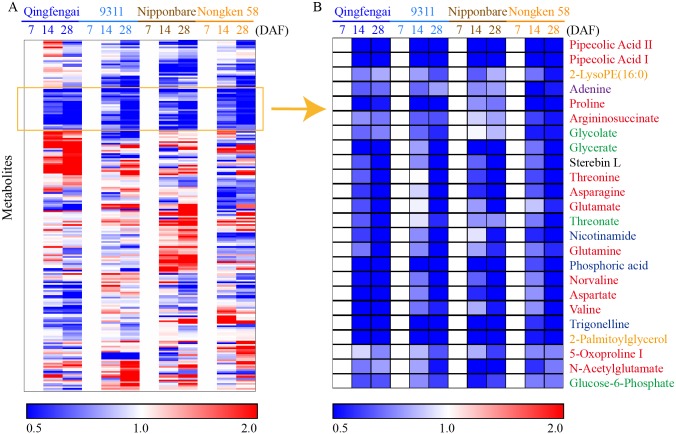
Fig 4. Heat map of metabolite changes in flag leaves from 7 DAF to 28 DAF.
Q, Nip and N represent Qingfengai, Nipponbare and Nongken 58, respectively. Ratios of fold changes are given by shades of red or blue colors according to the scale bar. Data represent mean values of four biological replicates for each cultivar and time point. For full metabolite names, refer to S2 Table.

