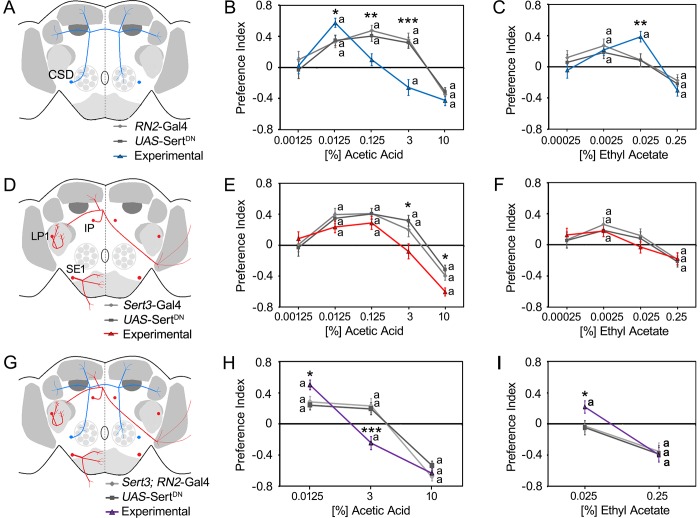
Fig 1. Key odorant attraction regulated by altered serotonin signaling.
A, Schemata of the CSD neurons (blue lines) targeted by RN2-Gal4 (D) of the LP1, IP, and SE1 neuron clusters (red lines) targeted by the Sert3-Gal4 and (G) neurons targeted by both drivers are shown. B, Expression of the UAS-SertDN transgene under control of the RN2-Gal4 line significantly increased the attraction to 0.0125% acetic acid (AA) mixed with food odors and inhibited or even reversed the preference for 0.125% and 3% AA (N = 15–36). C, The expression significantly increased the attraction to 0.025% ethyl acetate (EtOAc)-enriched food odors (N = 17–32). E, Expression of UAS-SertDN in a Sert3-Gal4-dependent manner significantly inhibited the attraction to 3% AA and increased the aversion to 10% AA within food odor blends (N = 16–33). F, The expression did not significantly affect the behavioral response to EtOAc (N = 16–30). H, The expression of the mutant SERT protein under the control of the Sert3-Gal4; RN2-Gal4 drivers significantly increased attraction to 0.0125% AA but significantly reversed the attraction to 3% AA in food odors to aversion (N = 22–29). I, The behavioral attraction to 0.025% EtOAc was significantly increased in the experimental group (N = 27–32). A significant difference from random choice is labeled with the letter a as determined by one-sample sign test (P < 0.05). The stars indicate a significant difference between the experimental and two control groups as determined by ANOVA with post hoc Tukey-Kramer analysis with *P < 0.05, **P < 0.01, and ***P < 0.001. For the underlying numerical data see S3 Table.

