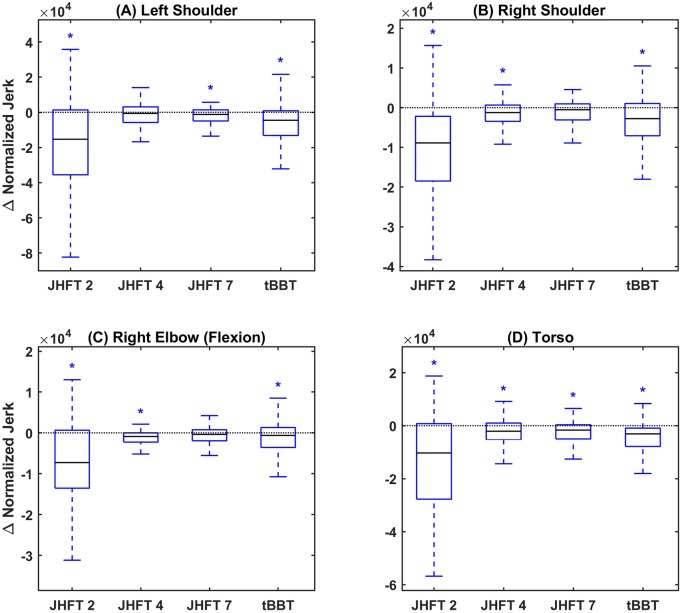
Fig 3. Smoothness (normalized jerk).
Difference in normalized jerk between sessions summarized as a boxplot for (A) left shoulder joint, (B) right shoulder joint, (C) right elbow joint, and (D) torso. Blue boxes indicate medians below zero, or improved smoothness, red boxes indicate medians above zero, or decreased smoothness. X axis ticks indicate JHFT task number (2, 4, and 7) and tBBT.

