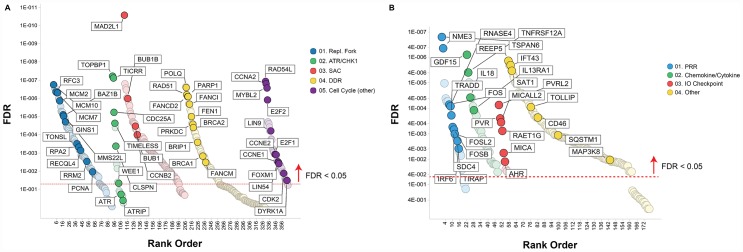
Figure 4.
Pathways associated with prexasertib sensitivity (A) or resistance (B) across pan-cancer cell line panel. Association between gene expression from RNASeq data and drug response (geometric mean IC50) was calculated as described in the Materials and Methods section and plotted as a function of FDR (y-axis) and gene classification (x-axis) according to pathways and gene sets identified by GSEA.

