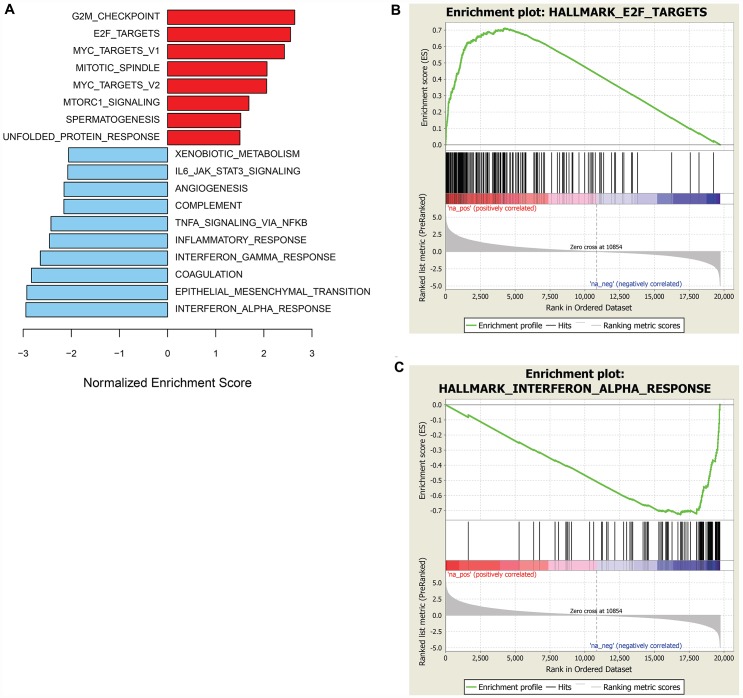
Figure 5. GSEA of genes associated with sensitivity or resistance to prexasertib in the sarcoma and neuroblastoma xenograft cohort.
Bar plot of top hallmark gene sets associated with sensitivity (red) or resistance (blue) using FDR<0.05 (A) and representative enrichment plots highlighting top scoring gene sets associated with prexasertib sensitivity (B) or intrinsic resistance (C).

