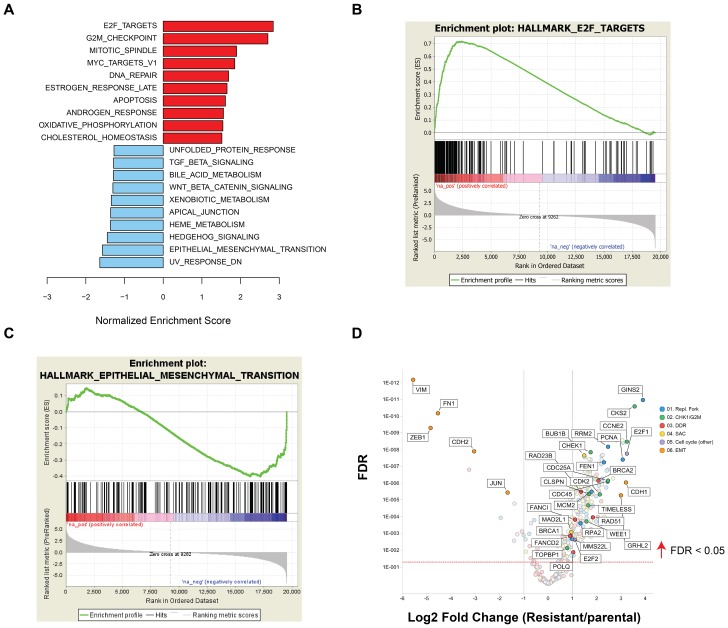
Figure 7. GSEA of differentially expressed genes between NCI-H520 and NCI-H520R cell lines.
(A) Bar plot showing top upregulated (red) or downregulated (blue) gene sets in resistant versus parental tumor cell lines and representative enrichment plots highlighting key hallmarks associated with upregulated (B) or downregulated genes (C) in NCI-H520R over NCI-H520 tumor lines. (D) Volcano plot showing representative differentially expressed genes in NCI-H520 parental versus NCI-H520R prexasertib-resistant cells (FDR<0.05).

