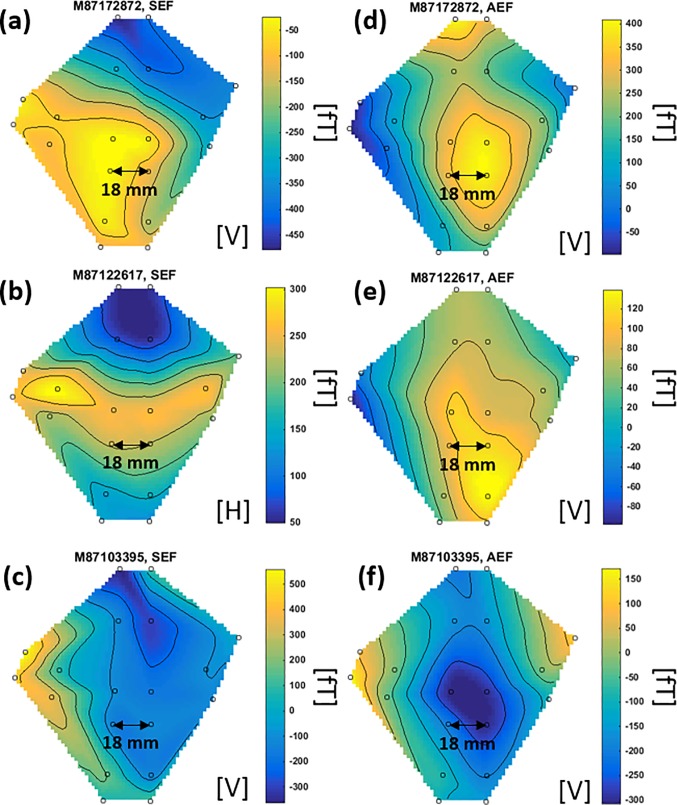
Fig 12.
Spatial topographies of SEF (a-c) and AEF (d-f) for all three subjects. N20m and N100m peaks are used to create the field-maps for SEF (at ~20 ms latency) and AEF (at ~100 ms latency), respectively. The field-maps show the measured magnetic flux density (fT). [V]: Vertical axis measurement, [H]: Horizontal axis measurement. A cubic interpolation method is used to interpolate between channels.

