Fig. 6.
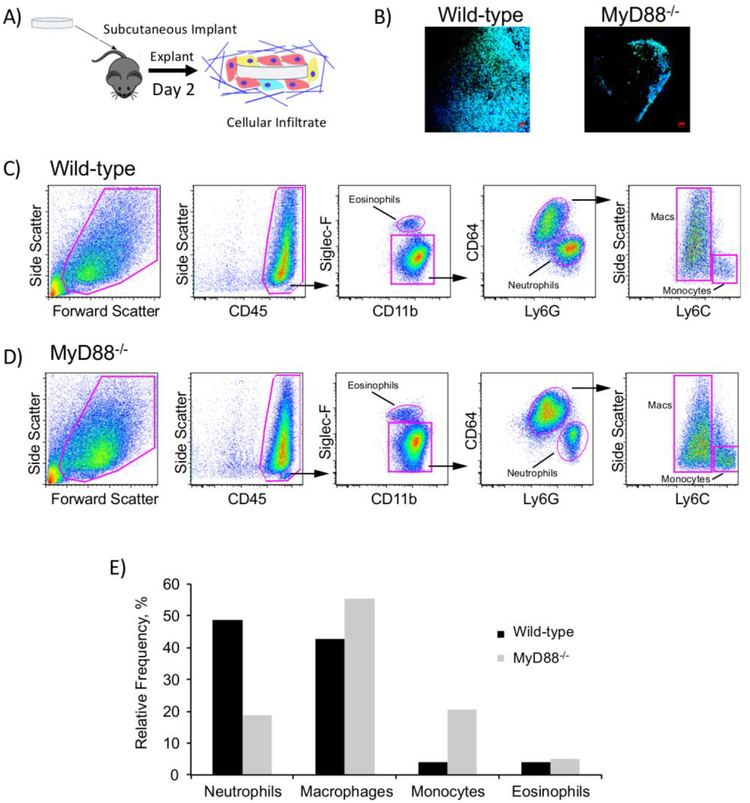
In vivo assessment of the FBR and the cells that interrogate the implant surface at 2 d. A) Schematic depicting implantation and subsequent analysis. B) Representative confocal microscopy images of hydrogels explanted after 2 d showing cell attachment to the surface. Cells were strained with F-actin (green) and counterstained with DAPI for cell nuclei (blue); scale bar is 50 μm. C, D) Flow cytometry assessment of leukocytes in and around the implant after 2 d. Hydrogels and surrounding tissue were explanted and enzymatically digested. Cell suspensions were stained with monoclonal antibodies and leukocytes assessed with flow cytometry. Four hydrogel implants were pooled to achieve sufficient cell numbers to perform flow cytometry. Gating strategies and representative dot plots are shown for WT (C) and MyD88−/− mice (D). E) Relative frequency of each leukocyte subset.

