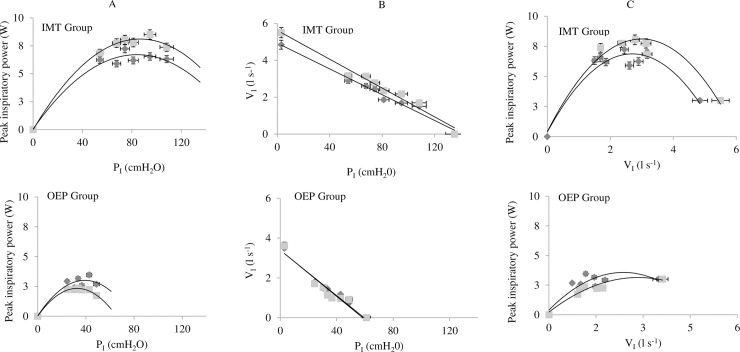
Fig 2.
A. Peak power vs inspiratory mouth pressure PI (cmH2O). B. Inspiratory mouth pressure PI (cmH2O) vs inspiratory flow rate VI (l s-1). C. Inspiratory peak power (Watts) vs inspiratory flow rate VI (l s-1). Before (♦) and after ( ) 8 weeks of inspiratory muscle training (IMT) and Otago exercise program (OEP). Data are represented as mean ± percentage error.

