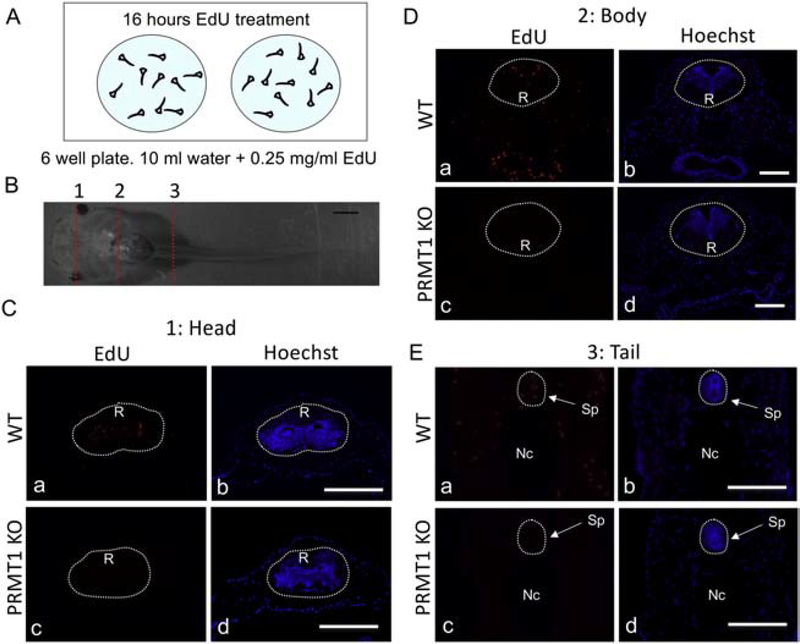
Figure 6. Reduced proliferating cells in brain and spinal cord of PRMT1 knockout tadpoles.
(A) Schematic diagram for EdU treatment. The 10-day old tadpoles were treated with or without 0.25 μg/ml EdU in 10 ml water for 16 hours in the 6-wells plate, each well contained 10 randomly selected tadpoles. They were then genotyped and sectioned for cell proliferation analyses (EdU staining).
(B) Representative photo of a 10-day-old tadpole. The 10-day old of wild-type tadpole from dorsal view showing three regions as marked with dotted lines: 1 or the upper head regions, 2 or lower head/upper body region, and 3 or tail region, for tissue sections. Bar: 1 mm.
(C) PRMT1 homozygous knockout tadpoles (PRMT1 KO) have drastically reduced cell proliferation in the upper head region. Sections from region 1 (see B) of wild type ( a, b) and PRMT1 knockout (c, d) tadpoles were stained for EdU to detect proliferating cells. The dotted lines depict the brain region, drawn based on morphological differences in the pictures of the stained tissues, under enhanced contrast and/or brightness by using Photoshop, if needed. EdU, red-color (a, c) and Hoechst, blue-color (b, d). R: rhombencephalon.
(D) PRMT1 KO tadpoles have drastically reduced cell proliferation in the lower head/upper body region. Sections from region 2 (see B) of wild type ( a, b) and PRMT1 knockout (c, d) tadpoles were stained for EdU to detect proliferating cells. The dotted lines depict the brain region, drawn based on morphological differences in the pictures of the stained tissues, under enhanced contrast and/or brightness by using Photoshop, if needed. EdU, red-color (a, c) and Hoechst, blue-color (b, d). R: rhombencephalon.
(E) PRMT1 KO tadpoles have drastically reduced cell proliferation in spinal cord of the tail region. Sections from region 3 (see B) of wild type ( a, b) and PRMT1 knockout (c, d) tadpoles were stained for EdU to detect proliferating cells. The dotted lines depict the spinal cord region, drawn based on morphological differences in the pictures of the stained tissues, under enhanced contrast and/or brightness by using Photoshop, if needed. EdU, red-color (a, c) and Hoechst, blue-color (b, d). Nc: notochord, Sp: spinal cord. At least 3 tadpoles were analyzed for all genotypes. Bars: 100 μm. At least three different animals and three sections from each animal were analyzed. The similar results were obtained from at least two different batches of tadpoles.

