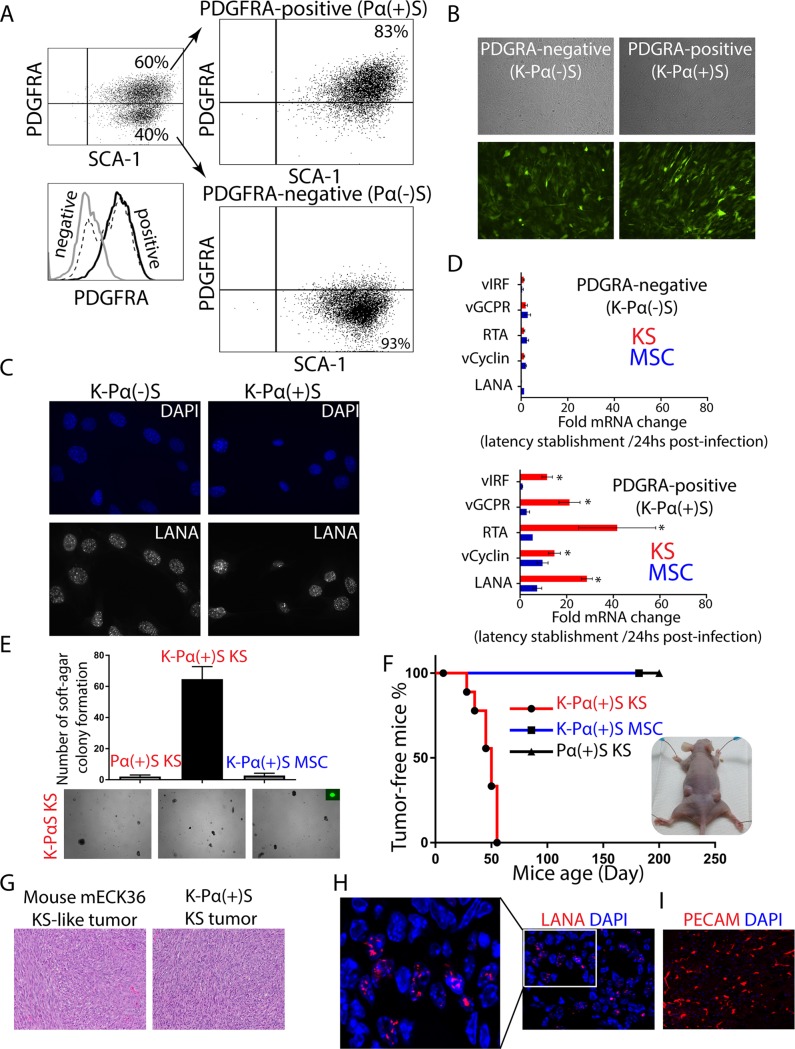
Fig 1. KSHV infection is only tumorigenic in infected MSC PDGFRA-positive lineage grown in pro-angiogenic KS-like environment.
A) Mouse bone marrow-derived mesenchymal stem cells were stained for PDGFRA (Pα) and SCA-1 (S) expression. Mouse MSC Sca-1-positive, PDGFRA-positive (Pα(+)S) and negative (Pα(-)S) populations were sorted by flow cytometry. B) PDGFRA-positive (Pα(+)S) and PDGFRA-negative (Pα(-)S) MSCs were latently infected with rKSHV.219 and analyzed for GFP expression using a fluorescence microscope. C) Immunofluorescence analysis of KSHV-infected Pα(+)S (K- Pα(+)S) and Pα(-)S (K- Pα(-)S) to evaluate KSHV LANA expression (red), nuclei were counterstained with DAPI (blue). D) Fold-changes in KSHV gene expression between 24 hours KSHV post-infection and after KSHV latency establishment in MSC or KS-like media as determined by RT-qPCR. Triplicates are shown as means ± SD. K-Pα(-)S population on the top and K-Pα(+)S population on the bottom. *P < 0.05. E) Soft agar colony formation assay to determine anchorage-independent cell growth in Pα(+)S KS, K-Pα(+)S MSC, and K-Pα(+)S KS cells. F) Kaplan-Meier percent tumor-free survival curve from subcutaneous injection of Pα(+)S KS, K-Pα(+)S MSC, and K-Pα(+)S KS cells into nude mice. N = 6. G) Representative microscopic histological section of mouse KS-like mECK36 tumor and K-Pα(+)S KS tumor stained with hematoxylin and eosin (H&E). H) Immunofluorescence analysis of KSHV LANA (red) in K-Pα(+)S KS tumor, nuclei were counterstained with DAPI (blue). I) Immunofluorescence analysis of PECAM1 (red) in K-Pα(+)S KS tumor, nuclei were counterstained with DAPI (blue).

