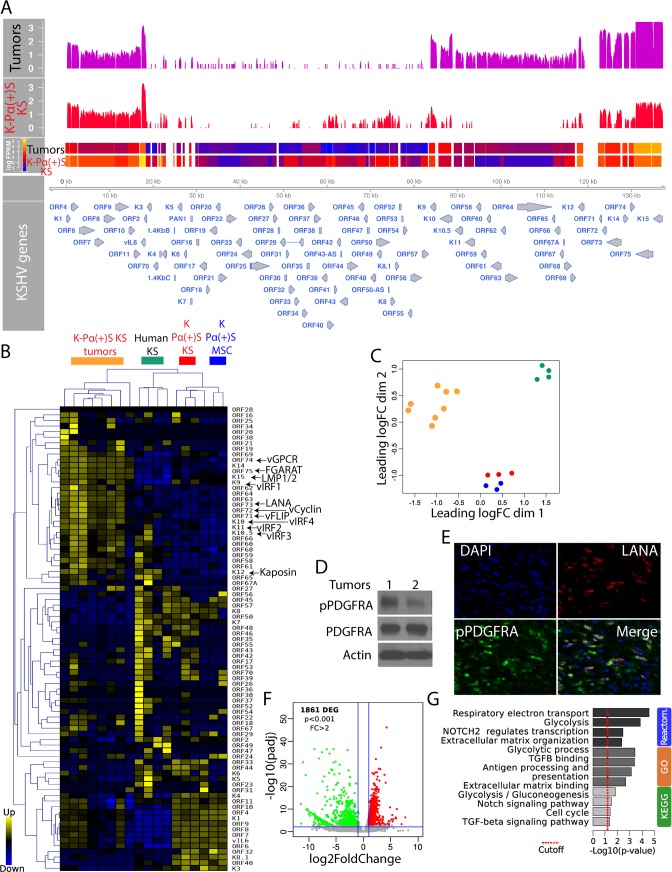
Fig 2. Upregulation of KSHV lytic gene expression during in vivo tumorigenesis.
A) Genome-wide analysis of KSHV transcripts by RNA deep sequencing, comparison of the transcription profiles of K-Pα(+)S KS cells (N = 3) and K-Pα(+)S KS tumors (N = 8) derived from these cells. Levels of viral gene transcription were quantified in reads per kilobase of coding region per million total read numbers (RPKM) in the sample. The y-axis represents the number of reads aligned to each nucleotide position and x-axis represents the KSHV genome position. B) Unsupervised hierarchical clustering of KSHV transcriptome among K-Pα(+)S KS cells, K-Pα(+)S KS tumors and human KS tumors. The arrows indicate KSHV oncogenes. C) Multidimensional scaling plot showing the distance of each sample from each other determined by their KSHV expression profiles. D) Total and phospho-PDGFRA were determined by immunoblotting in two MSC K-Pα(+)S KS tumors. Actin was used as a loading control. E) Immunofluorescence analysis of K-Pα(+)S KS tumors to detect KSHV LANA (red) and phospho-PDGFRA (green). Cell nuclei were counterstained with DAPI (blue). F) Volcano plot showing 1,861 differentially expressed genes (DEGs) analyzed by RNA-Seq between K-Pα(+)S KS tumors in vivo and K-Pα(+)S KS cells in vitro. G) Functional enrichment analysis based on genes differentially expressed among K-Pα(+)S KS tumors and K-Pα(+)S KS cells.

