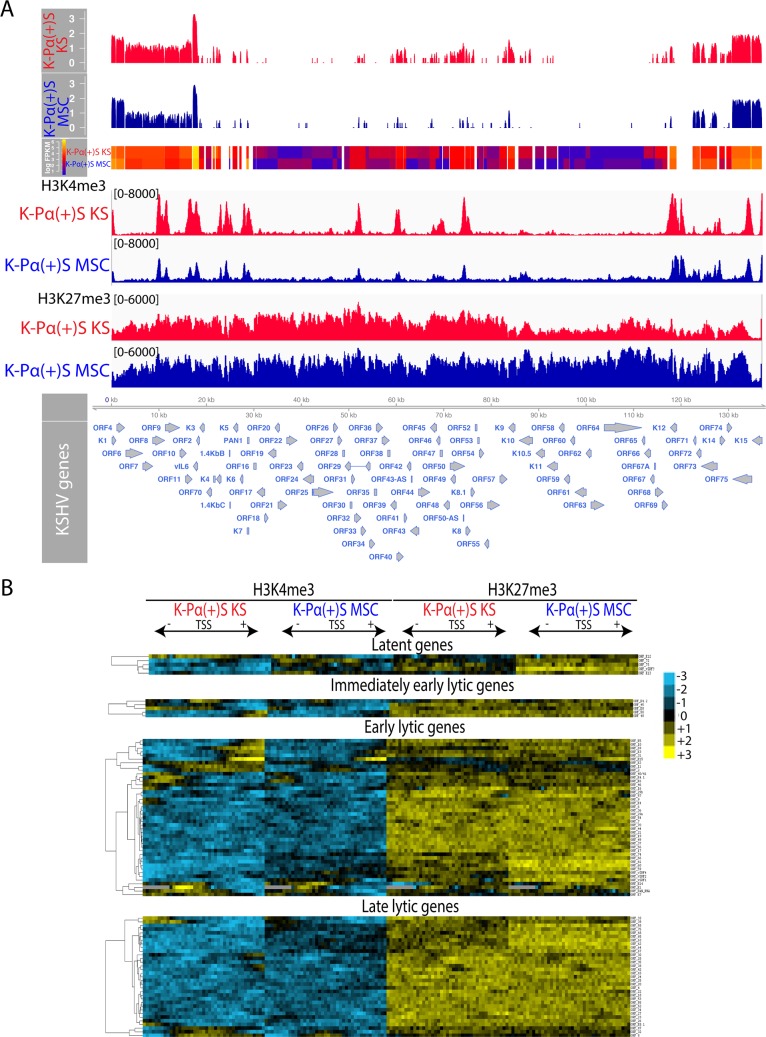
Fig 3. A de-repressed KSHV epigenome allows for expression of oncogenic KSHV genes in tumorigenic PDGFRA-positive MSCs growing in KS-like environment.
A) Genome-wide analysis of KSHV transcripts by RNA deep sequencing, comparison of the transcription profiles of MSC K-Pα(+)S MSC and K-Pα(+)S KS cells. Transcriptional levels for viral genes were quantified in reads per kilobase of coding region per million total read numbers (RPKM) in the sample. The y-axis represents the number of reads aligned to each nucleotide position and x-axis represents the KSHV genome position. Global patterns of H3K4 tri-methylation (H3K4me3) and H3K27 tri-methylation (H3K27me3) in K-Pα(+)S MSC and K-Pα(+)S KS cells were analyzed by ChIP-seq assays as described in the text. Values shown on the y-axis represent the relative enrichment of normalized signals from the immunoprecipitated material over input. B) Heat map representation of changes in histone modifications at the gene regulatory regions of KSHV genes grouped by expression class Latent, Immediate-early lytic, Early lytic and Late lytic genes. The rows display the relative abundance of the indicated histone modification within the −1 kb to +1 kb genomic regions flanking the translational start site (TSS) of each viral gene. The blue and yellow colors denote lower-than-average and higher-than-average enrichment, respectively.

