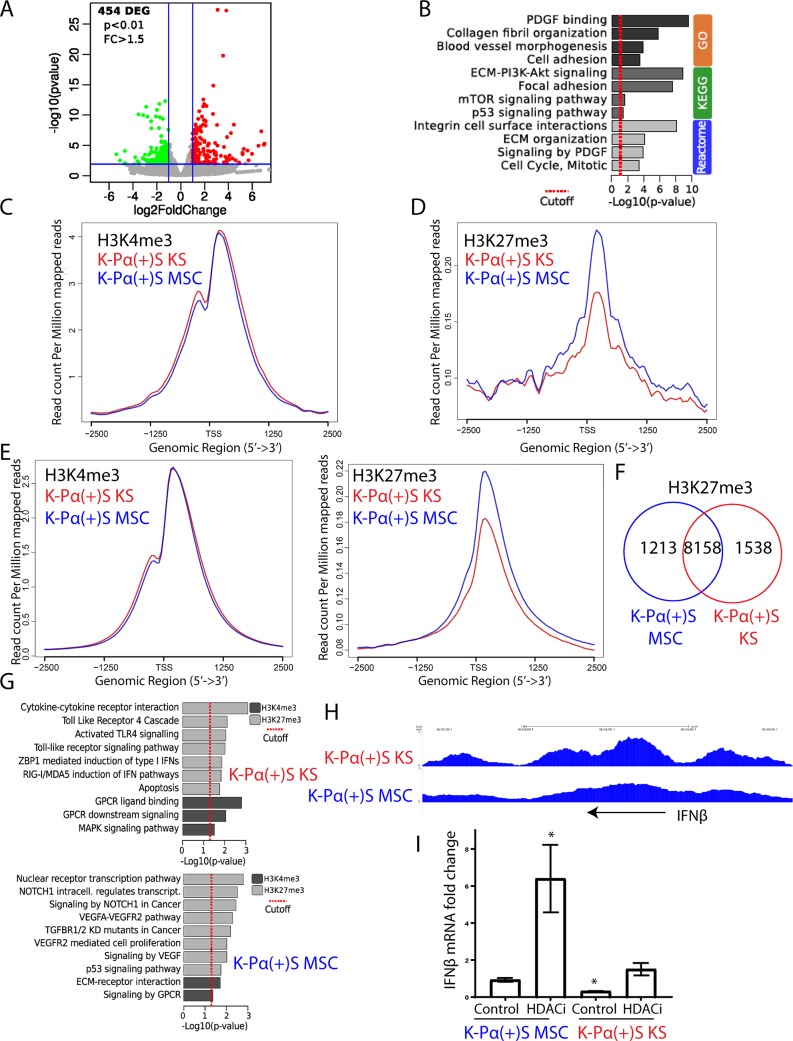
Fig 4. Global gene expression profiling and histone marks distribution in K-Pα(+)S KS and K-Pα(+)S MSCs.
A) Volcano plot showing 454 differentially expressed genes (DEGs) analyzed by RNA-seq between K-Pα(+)S MSC and K-Pα(+)S KS cells. B) Functional enrichment analysis based on genes differentially expressed among K-Pα(+)S MSC and K-Pα(+)S KS cells. C) H3K4me3 ChIP-seq signals on DEGs in K-Pα(+)S MSC and K-Pα(+)S KS cells. D) H3K27me3 ChIP-seq signals on DEGs in K-Pα(+)S MSC and K-Pα(+)S KS cells. E) H3K4me3 (left) and H3K27me3 (right) ChIP-seq signals in K-Pα(+)S MSC and K-Pα(+)S KS cells. F) Venn diagrams showing the overlap between H3K27me3-enriched genes in K-Pα(+)S MSC and K-Pα(+)S KS cells. G) Pathway analysis representing KEGG and REACTOME pathway enriched by the genes with differentially enriched regions (DERs) of H3K27me3 and H3K4me3 in K-Pα(+)S MSC (bottom) and K-Pα(+)S KS (top) cells. H) Genome browser screenshots of H3K27me3 ChIP-seq signal in K-Pα(+)S MSC and K-Pα(+)S KS cells at the IFNβ genomic region. I) Fold-changes of IFNβ gene expression in K-Pα(+)S MSC and K-Pα(+)S KS cells before and after KSHV lytic reactivation, determined by RT-qPCR. Triplicates are shown as means ± SD. *P < 0.05.

