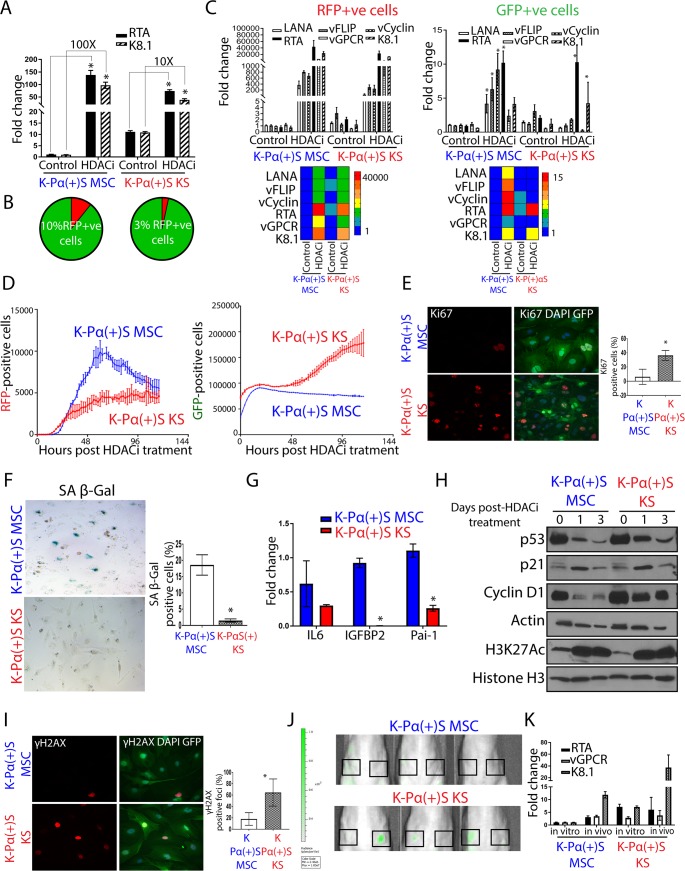
Fig 5. A permissive epigenetic landscape induced by a pro-angiogenic environment promotes an oncogenic viral lytic-driven mechanism of tumorigenesis.
A) Fold-changes of KSHV gene expression in K-Pα(+)S MSC and K-Pα(+)S KS cells after SAHA (7,5 uM) treatment for 24 hours, determined by RT-qPCR. Triplicates fold change to un-induced K-Pα(+)S MSC are presented as means ± SD. *P < 0.05. B) Percentage of RFP-positive and GFP-positive cells after 72 hours of KSHV reactivation measured by Flow cytometry in K-Pα(+)S MSC and K-Pα(+)S KS cells. C) Left panel, fold-changes of KSHV gene expression in sorted RFP-positive population of K-Pα(+)S MSC and K-Pα(+)S KS cells after 72 hours of SAHA treatment were determined by RT-qPCR. Triplicates fold change to un-induced K-Pα(+)S MSC are presented as means ± SD. *P < 0.05. The heatmap for the mean RT-qPCR data is shown below. Right panel, fold-changes of KSHV gene expression in sorted GFP-positive population in K-Pα(+)S MSC and K-Pα(+)S KS cells after 72 hours of SAHA treatment were determined by RT-qPCR. Triplicates fold change to un-induced K-Pα(+)S MSC are presented as means ± SD. *P < 0.05. The heatmap for the mean RT-qPCR data is shown below. D) K-Pα(+)S MSC and K-Pα(+)S KS cells were treated with SAHA and incubated in an Incucyte Zoom (Essen Bioscience), acquiring red and green fluorescence images. The cell proliferation graphs of RFP-positive (left panel) and GFP-positive (right panel) cells were graphed over time as a measure of proliferation and shown as mean ± SE from three replicates for each condition. E) Immunofluorescence analysis of Ki67 expression (red) was performed after 72 hours of SAHA treatment on GFP-positive K-Pα(+)S MSC and GFP-positive K-Pα(+)S KS cells; nuclei were counterstained with DAPI (blue).The quantification is shown at the right of the images. Values are presented as means ± SD. *P < 0.05. F) SA β-gal staining was performed after 72 hours of SAHA treatment on K-Pα(+)S MSC and K-Pα(+)S KS cells. The quantification is shown at the right of corresponding panels. Values are presented as means ± SD. *P < 0.05. G) mRNA fold-changes of markers of senescence and SASP or Senescence Associated Secretory Phenotype in K-Pα(+)S MSC and K-Pα(+)S KS after 72 hours of SAHA treatment were assessed by RT-qPCR in triplicate and are presented as means ± SD. *P <0.05. H) p53, p21, and Cyclin D1 levels were analyzed by immunoblotting in K-Pα(+)S MSC and K-Pα(+)S KS cells after 72 hours of SAHA treatment. Histone 3 K27 Acetylation (H3K27Ac) was used as the control for HDAC inhibition by SAHA. Actin was used as loading control. I) Immunofluorescence analysis of ƴH2AX expression (red) was performed after 72 hours of SAHA treatment on GFP-positive K-Pα(+)S MSC and GFP-positive K-Pα(+)S KS cells; nuclei were counterstained with DAPI (blue). The quantification is shown at the right of the images. Values are presented as means ± SD. *P < 0.05. J) Spectrum In Vivo Imaging System (IVIS) of Matrigel-plugs (1 week after injection) containing GFP-positive PDGFRA-positive MSCs from K-Pα(+)S MSC and K-Pα(+)S KS cells. Black Squares indicate site of injection. K) Fold-changes of KSHV gene expression in K-Pα(+)S MSC and K-Pα(+)S KS after 1 week in vivo Matrigel-plug were assessed by RT-qPCR in triplicate and are presented as means ± SD.

