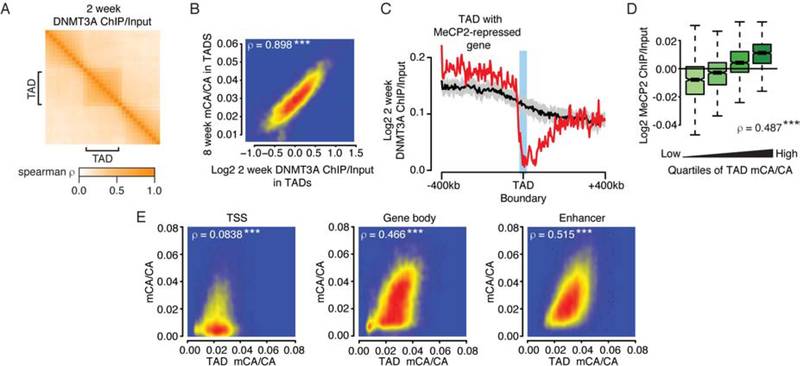
Figure 2. Domain-associated DNMT3A defines megabase- and kilobase-scale mCA levels.
A. Cross-correlations in and around TADs for DNMT3A ChIP at 2 weeks (see methods).
B. Comparison of DNMT3A ChiP/Input at 2 weeks and mCA/CA levels at 8 weeks for each TAD. ***, p<10−8.
C. Aggregate DNMT3A ChIP/Input at 2 weeks at boundaries of TADs containing MeCP2-repressed genes. Black line and ribbon indicate the mean and standard deviation of shuffled TAD boundaries (see methods).
D. MeCP2 ChIP/Input in TADs for quartiles of TAD mCA/CA. ***, p<10−8.
E. Comparison of TAD mCA/CA levels and mCA/CA levels at kilobase-scale genomic elements in each TAD at 8 weeks of age (see methods). ***, p<10−8.
See also Figure S3 and Table S2, S4.
Data from cerebral cortex of 2 or 8 week-old animals. Per time point: n=2–3 for DNMT3A ChIP-seq, n=2 wild type for DNA methylation (Stroud et al., 2017).

