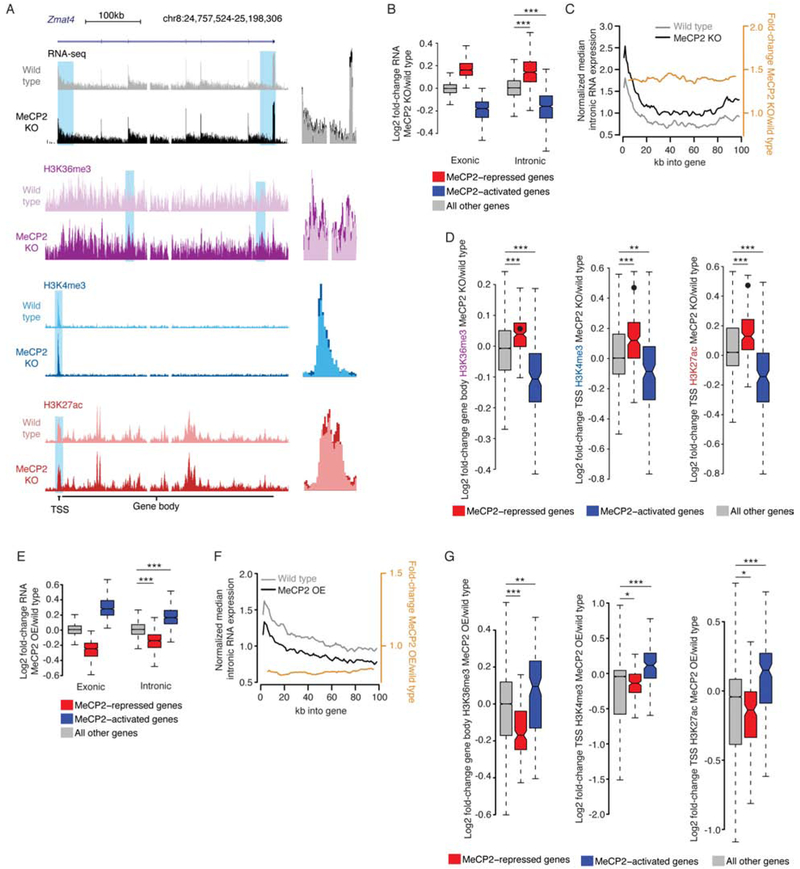
Figure 3. Disruption of MeCP2 leads to promoter-associated transcriptional dysregulation.
A. Left, genome browser view of nuclear total RNA-seq and ChIP-seq from MeCP2 KO and wild type at an MeCP2-repressed gene, Zmat4. Right, overlay of MeCP2 KO and wild type signal illustrating subtle increases for blue highlights at left.
B. Changes in RNA-seq signal in the MeCP2 KO for exons in whole cortex RNA (Exonic), or introns in nuclear RNA (Intronic). Genesets defined in combined analysis of exonic RNA (see Figure 1A). ***, p<10−8 Wilcoxon test.
C. Profile (black, gray) and fold-change (orange) of intronic reads from RNA-seq for the first 100kb of upregulated genes in MeCP2 KO versus wild type (Figure S4B). Normalized median of 1kb bins is plotted for genes >100kb (see methods, and Figure S4G, H).
D. Fold-changes in ChIP signal in MeCP2 KO at MeCP2-regulated genes identified in intronic RNA analysis. Value for Zmat4 is indicated by a point on each plot. **, p<10−3; ***, p<10−8 Wilcoxon test.
E. Fold-changes in gene expression as in panel B, but for MeCP2 OE. ***, p<10−8 Wilcoxon test.
F. Profile of intron expression and fold-change as in panel C, but for MeCP2 OE. (see also Figure S4I).
G. Fold-changes in ChIP signal as in panel D but for MeCP2 OE. *, p<0.05; **, p<10−3; ***, p<10−8 Wilcoxon test.
See also Figure S4 and Table S1.
Data from cerebral cortex of 7–10 week-old animals. MeCP2 KO per genotype: n=6 for RNA-seq, n=3 for H3K36me3, n=4 for H3K4me3, n=5 for H3K27ac. MeCP2 OE per genotype: n=5 for RNA-seq, n=2 each for H3K36me3 and H3K4me3, n=3 for H3K27ac.

