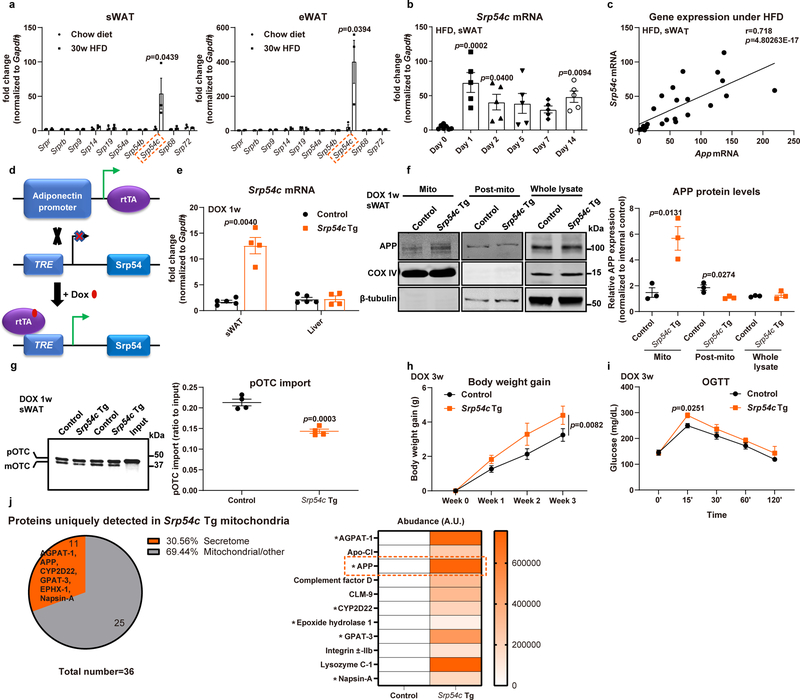
Extended Data Fig. 5. Dysregulation of SRP54c is responsible for mistargeting of APP into adipocyte mitochondria (related to Fig. 5).
(a-b) SRP subunit gene mRNA levels in anchoring adipocytes in 30-week HFD and chow fed mice (a, left: sWAT; right: eWAT, n=3 mice per group) and Srp54c mRNA levels from sWAT in acute HFD challenged wild-type mice for 0, 1, 2, 5, 7 and 14 days (b), n=7 mice in Day 0 group and n=5 mice in Day 1, 2, 5, 7 and 14 groups. (c) The correlation between Srp54c mRNA levels in sWAT from HFD challenged wildtype mice with App mRNA expression, n=32. (d) Schematic illustration of the adipocyte-specific, Dox-inducible SRP54c transgenic mouse model. (e) Validation of SRP54c overexpression in WAT of transgenic mice fed with 1-week Dox 600mg/kg diet by detecting Srp54c mRNA levels in different tissues from control (Control) and SRP54c overexpressing (Srp54c Tg) mice (n=4 mice per group). (f) Representative Western blotting image (left panel) for APP in purified mitochondrial, post-mito, and whole tissue lysate from sWAT in 1-week Dox fed mice and its quantification (right panel). n=3 mice per group. Images are chosen from three independent experiments. (g) Representative autoradiography image (left panel) and statistics (right panel) of pOTC import assessed in isolated mitochondria (incubation for 30 minutes) from sWAT of 1-week Dox fed control or Srp54c Tg mice. 25% of [35S]pOTC added to each reaction is loaded as input. n=4 mice per group. (h-i) Upon 3-week Dox feeding, both control and Srp54c Tg mice are subject to metabolic analysis, including (h) body weight monitoring and (i) OGTT assays. n=4 mice per group. (j) Proteomics analysis performed in purified mitochondria from WAT of control and Srp54c Tg mice: left, percentage of secretome proteins among uniquely detected proteins in Srp54c Tg mitochondria; right, heat map depicting enrichment of identified proteins belonging to secretome (* indicates a polypeptide containing a well-defined ER signaling sequence). For all statistical graphs, numeric data are presented as mean ± SEM of biologically independent samples. Two-tailed Student’s t-test (a, e-g); One-way ANOVA followed by a Tukey post-test (b); Pearson correlation analysis for correlation coefficient (r) and two-tailed p-value (c); Two-way ANOVA followed by a Tukey post-test (h-i).

