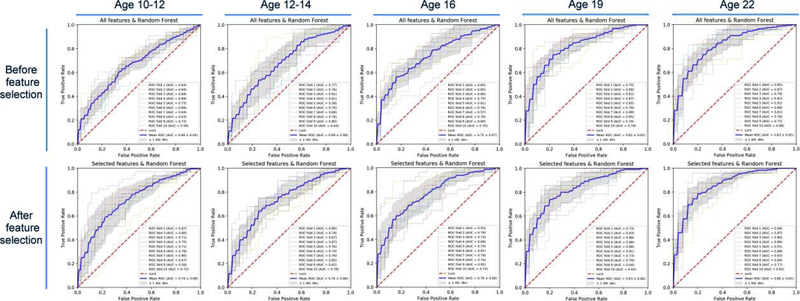
Figure 3.
Random forest (RF) prediction before and after features selection. Top figures depict models generated using all the features in the dataset. Bottom figures depict the performances of models using the selected (n=30) features. In each chart, the blue line shows the average ROC curve in the 10-fold cross validation and the gray areas shows the standard deviation. ROC curves. The other colors show the detailed performances of the models in the cross validation.

