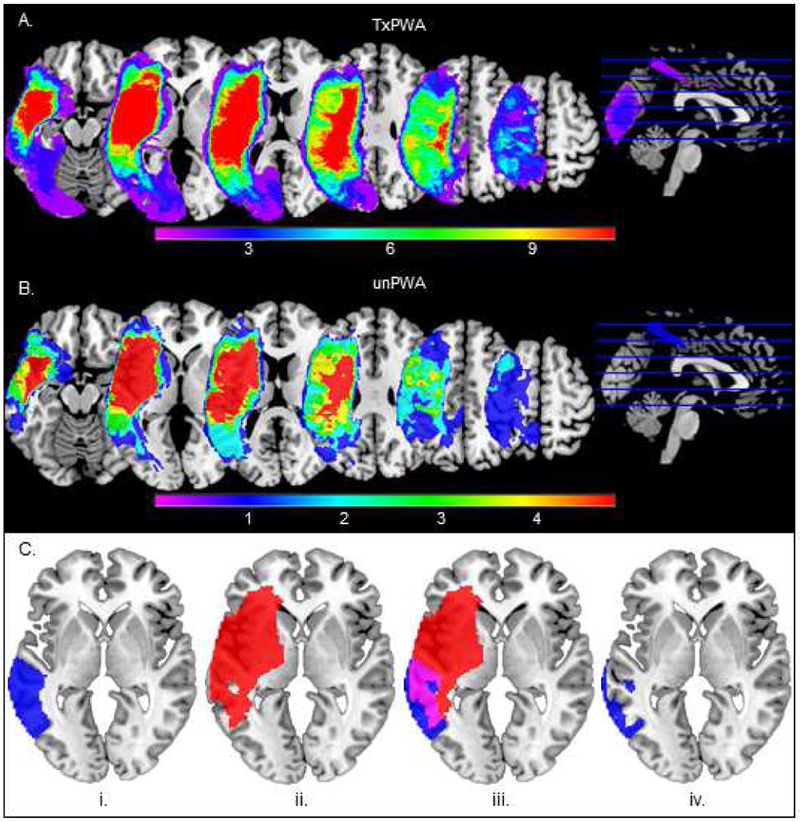
Figure 2.

Lesion overlay for patients in the (A) treatment group (TxPWA) and (B) untreated group (unPWA). Warmer colors indicate areas of greater lesion overlap among patients and cooler colors indicate areas where fewer patients have lesions. C. The process for creating patient-specific lesioned ROIs using one ROI (LMTG) in one patient (BU17) as an example. The atlas-based ROI (i, blue) and patient’s lesion map (ii, red) are overlaid and their intersection (iii, violet) is deleted, leaving behind whatever portion of the ROI is intact (iv, blue). This process was performed for all ROIs in all PWA.
